


Hello Traders,
It’s time for a special NASDAQ review! After trading NQ extensively, I’ve gained a solid pulse on its current behavior and forward outlook. The trend is undeniably bullish, with continuous all-time highs being printed. However, we’re starting to see signs suggesting a possible short-term pullback in search of liquidity and new buyers.
Key Market Observations:
Overextended & Lofty: NQ is trading well above value highs and riding outside its second standard deviation, signaling potential for a healthy pullback.
Low Volatility: Relative volume (rVol) has decreased by 50% throughout the last week, and the VIX is approaching historically low levels in the 11-12 range. Historically, when the VIX hits this zone, we tend to see an upward reaction in volatility, triggering a pullback in indices.
Critical Levels to Watch:
Support Levels:
21,535.25 (Significant Daily) & 21,527 (Untested 4-Hour):
These levels coincide with last week’s value area high and offer strong confluence for support on the first touch. If tested, a pop here could push us higher.
21,495 (Profile Magnet):
Below the key daily, this market profile inefficiency could attract price downward if the bulls lose 21,535. A break below could signal short-term bearish momentum.
21,450 (ETH Daily Support):
This is the only daily support propping the market up before we enter more critical zones. A failure here could trigger a larger move down.
21,283 (Untested Daily & Previous Weekly Leg Top):
A strong level offering an excellent long opportunity, combining previous weekly structure with an untested daily. This could be a solid reaction zone if the market drops further.
21,250 – 21,232 (Stacked Weekly/Daily Support + Naked POCs):
A stacked confluence zone containing significant levels from both daily and weekly timeframes. Losing this area would shift momentum away from bulls.
21,016 (High-Timeframe Daily/Weekly Combo):
A critical high-timeframe level that aligns with multiple key timeframes. If the market reaches this level, we’d want to see a strong bullish reaction to maintain the macro trend.
Resistance & Upside Targets:
21,715 (100% Fibonacci Extension):
Our first upside Fibonacci target, aligning with a major technical projection. A break above this level could spark a new bullish leg.
22,030 (123% Fibonacci Extension):
A high-probability extension target if the bullish trend continues strongly into next week.
Additional Key Levels:
21,445 - 21,250 (Weekly Low Volume Area):
This significant low-volume area indicates inefficiency in the market profile, likely acting as a magnet for price if sellers take control. Look for a strong reaction if price enters this zone, especially near the lower boundary at 21,250, where buyers may step in.
21,390 - 21,316 (Weekly Gap):
An untested weekly gap created during a strong move up. If price retraces into this area, expect increased volatility and a potential fill. This zone could attract sellers looking to capitalize on the gap fill opportunity.
Key Takeaways:
Bullish Case: As long as 21,535 holds, the bullish trend remains intact, with a potential push toward 21,715 and 22,030.
Bearish Case: If price breaks below 21,495, look for a potential correction toward 21,283 and 21,016, where buyers may step in.
What to Watch: Monitor volatility closely as the VIX remains historically low. If volatility spikes, indices could retrace toward major support zones.
I’ve included a detailed video breakdown covering the technical outlook and deeper explanations of each level. Stay focused, trade smart, and together we’ll conquer these markets!
Cheers,
Ryan Bailey
VICI Trading Solutions
Cheat Sheets:
Weekly VWAP and VOL Profile Chart

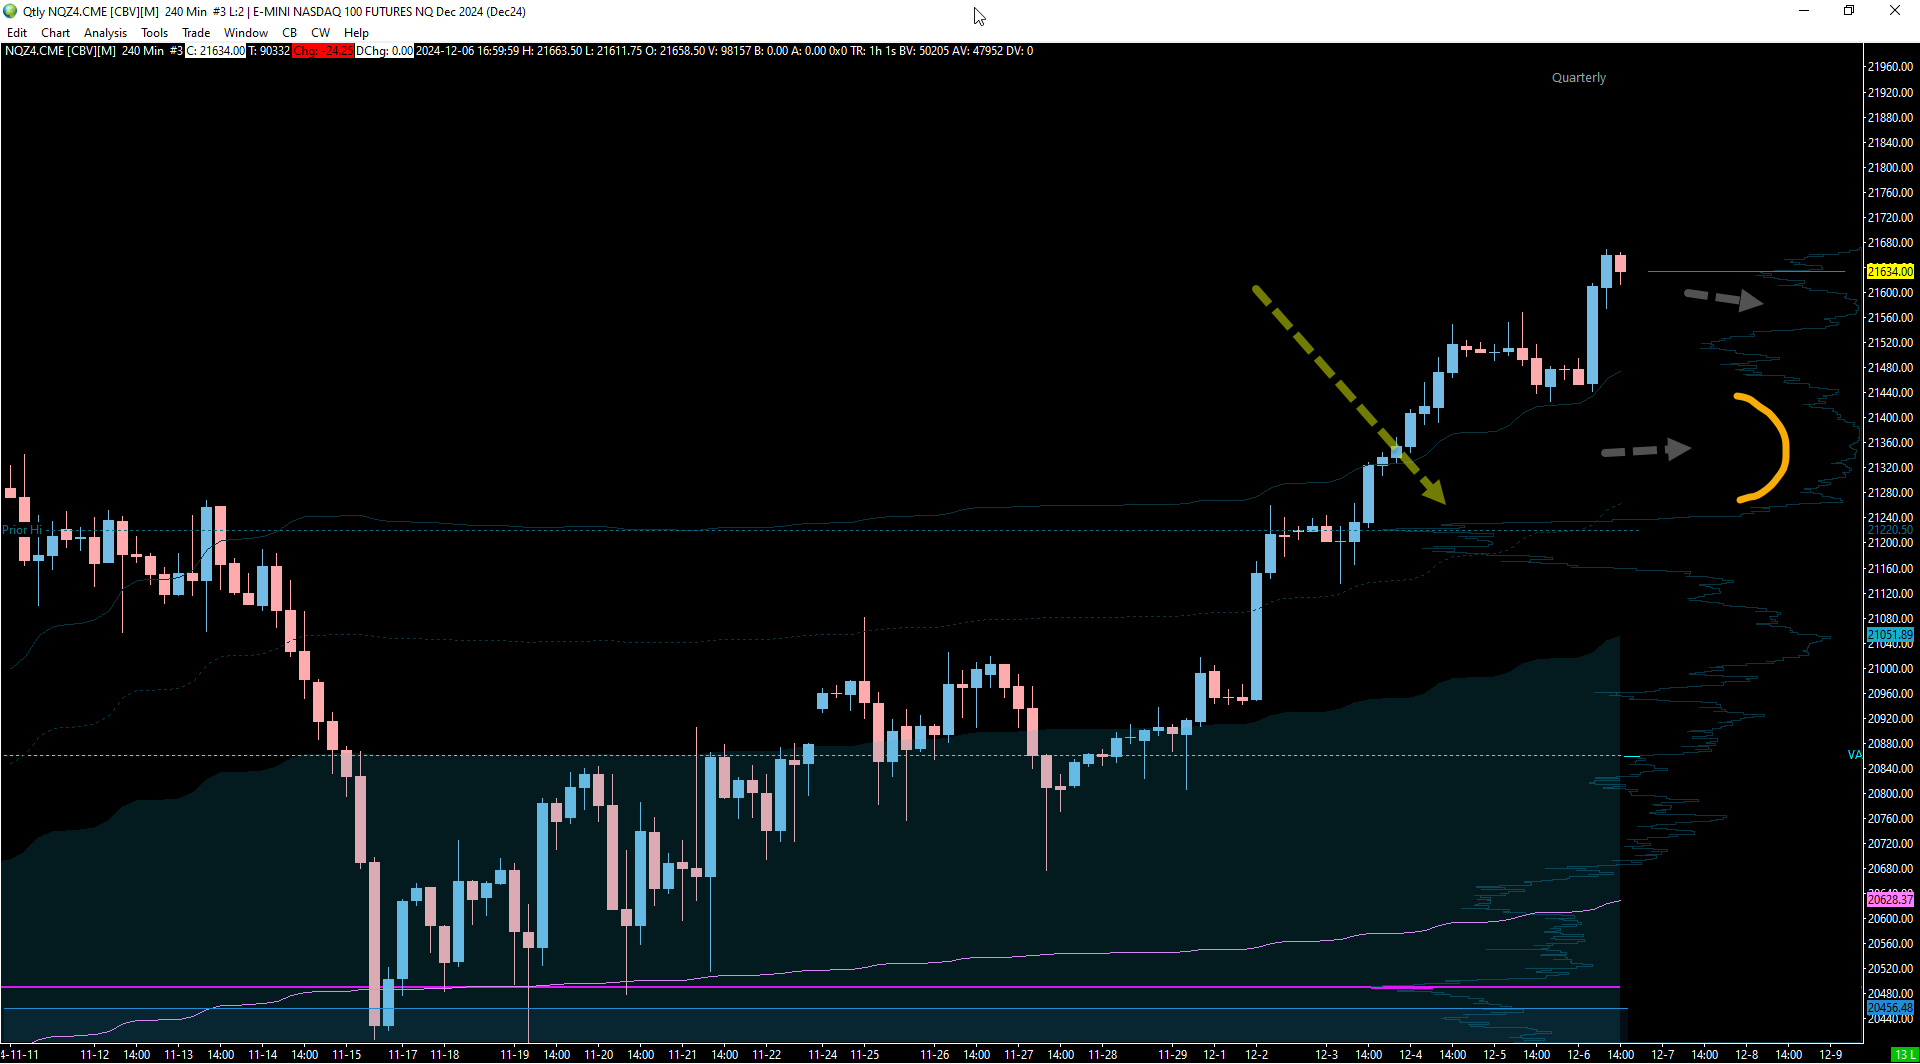
Quarterly VWAP and VOL Profile Chart
Daily Chart (Cash Session)

4hr Chart

1HR Chart


Share this post