Hello traders,
What a ride it has been! The past couple of weeks have kept us on our toes as the market balanced within a wide range and finally broke out on Wednesday. Last week we pointed out that cracks were starting to show in this market and thankfully our plans have been spot-on, and if you’ve been following them closely, it’s been nothing but wins!
Our key area of focus—5908, the critical daily and weekly level—continues to serve as a major pivot. The market’s struggle to push above this level confirms that buyers are facing headwinds. On Friday, we experienced a short squeeze, which briefly pushed prices to our 5897.75 daily resistance, but it quickly faded, dragging us back below the 5859 daily leg to the all-time highs.
The daily close below 5859 was a major failure for the bulls, raising questions about whether they have enough momentum to drive the market higher, or if this recent squeeze was just a head fake before more downside.
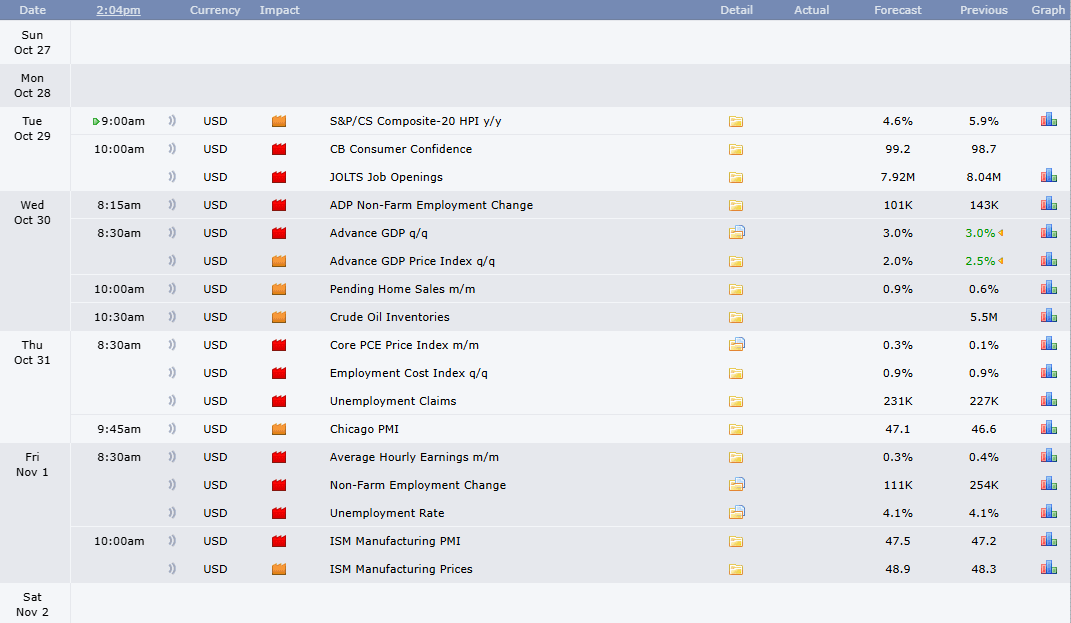
The coming week promises to be action-packed, with high-impact news events every day from Tuesday onward. This is in sharp contrast to the previous few weeks, where news has been relatively light. Get ready for volatility, and keep your eyes on key levels that will offer valuable opportunities for well-timed trades.
Take a look at the detailed trade plan and video below to see which untested levels we are focusing on and how we’ll position ourselves for the upcoming week.
Enjoy the rest of your weekend, and let’s get ready to conquer the markets together!
Cheers,
Ryan Bailey
Vici Trading Solutions
NEWS
LEVELS
Trade Plan
Overview:
This past week has been nothing short of phenomenal, with our trade plans playing out exactly as anticipated. Now, let’s look at the high timeframes and significant levels for the week ahead.
Friday’s failure to hold above 5859, the daily leg to the all-time high, suggests further weakness in the market. The bulls’ attempt to squeeze the market upward was short-lived, as resistance at 5897.75 capped the rally. With overhead resistance building at 5870, things are starting to lean bearish unless we can reclaim key levels.
Critical Levels to Watch:
5870 (Daily Resistance):
This level includes a cluster of single prints that need to be filled. A rejection here could signal continued downside.5875.25 (4-Hour Resistance):
This zone is packed with confluence—a naked POC from Friday sits here, along with an untested 4-hour level. If price plays into this area and drops back below 5859.25, it could set off a deeper correction.5842-37.75 (Daily Cluster/4-Hour Support):
This previously served as support, but with multiple tests, it is now at risk of breaking. If it gives way, expect a move toward 5823 daily.5823.75 (Daily):
A significant pivot level. Losing this level would shift momentum firmly toward the bears, targeting the next supports at 5811 and 5802-00.
Lower Support Levels:
5802 - 5800 (Daily/4-Hour Combo):
This level provided a powerful bounce on Wednesday, but further testing could weaken it. If this zone fails, we’ll shift our focus lower.5780.25 - 5778.25 (Weekly/Daily):
This is a key high timeframe Line in the Sand. Bulls need to defend this level to maintain control. If breached, we expect further downside.5755.75 - 5749.75 (Daily/Weekly):
A critical cluster of untested levels, combining both daily and weekly supports. This is a prime zone for buyers to step in. If this area holds, it could fuel a rally to new all-time highs.5723 (Weekly Bull/Bear Line):
If the market slips below 5749.75, expect a fast move toward 5723. This level marks the boundary between bullish continuation and bearish dominance. Below 5723, the bulls are in serious trouble.
Bearish Case:
5705.25 (4-Hour):
If 5723 fails, this is the next target. Bulls must reclaim 5726 quickly, or the move lower will accelerate.5690 (Weekly Leg Tip):
A break below this level signals a significant shift toward bearish sentiment.5666.00 (Major Bull/Bear Line):
This is the ultimate dividing line—if lost, it signals a complete momentum shift to the bears.
Upside Levels to Monitor:
5908 (Daily Level):
We must reclaim and close above this level on the daily timeframe to restore bullish momentum. If achieved, it sets the stage for a push higher.5918.75 (4-Hour) and 5923 (Daily):
Both are untested resistance levels that could provide reactions. Watch for pullbacks if price hits these zones, but clearing them will open the door for new highs and progress toward the unrepaired bullish imbalance.Unrepaired Bullish Imbalance:
This remains a key part of our outlook. While there’s no set timeline for when it will be resolved, it’s an important factor in our long-term bullish perspective.
Key Takeaways:
Critical Support Levels: Monitor 5780, 5823.75, and 5859.25 for potential momentum shifts.
Buy Zone: The 5755.75 - 5749.75 area is a high-probability support zone. If it holds, expect another push toward new all-time highs.
Bullish Bias: As long as 5859.25 holds, the bullish momentum remains intact. A break below 5823.75 will shift momentum to the downside.
Upside Targets: Watch 5918.75 (4-Hour) and 5923 (Daily) closely. Clearing these levels will keep the bulls in control and help resolve the imbalance above.
Stay sharp, follow the plan, and let’s conquer these markets!
Ryan Bailey
Vici Trading Solutions


Share this post