


The Power of Initial Balance (IB) in Day Trading:
A Detailed Guide with Case Studies

Traders it’s time for an education session…..
Day trading is all about precision, timing, and being able to read the market’s pulse as soon as the bell rings. One of the best tools you can have in your arsenal for navigating those first critical hours is the Initial Balance (IB). If you’re unfamiliar with it, or maybe you’ve heard of it but haven’t quite dialed in how to use it, this post is for you.
We’re going to take a deep dive into what the IB is, why it’s such a powerful tool for day traders, and walk through a couple of case studies to show how you can use it to anticipate market moves and place higher-probability trades.
What is the Initial Balance (IB)?
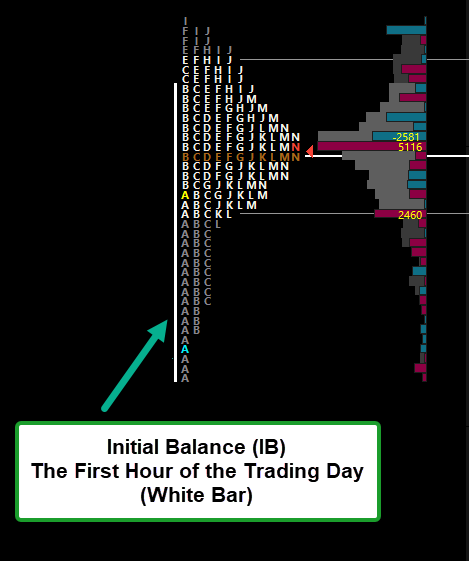
The Initial Balance is a price range created during the first hour of regular trading. This period—often referred to as the "golden hour"—is critical because it reflects the collective decisions of major market participants: institutional traders, hedge funds, market makers, and other key players. In that first hour, they’re establishing their positions, which creates a range within which price often remains confined… until it doesn’t.
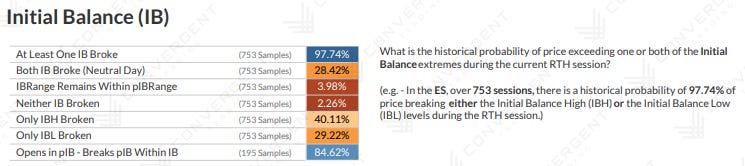
Here’s why the IB is so fascinating and useful: Historically, the IB is broken around 97% of the time. That means the market will breach either the IB high or IB low during the trading day, creating potential breakout opportunities. Understanding this tendency gives you a roadmap for predicting price movements as the day progresses.
Why the IB Matters
Think of the IB as the foundation for the day’s price action. It sets the tone for how the market is behaving—whether it’s trending, consolidating, or preparing for a big move later in the session. If price breaks above the IB high, it signals bullish momentum; if it breaks below the IB low, it signals bearish momentum. Sounds simple enough, right? But here’s where it gets fun: the market isn’t always that straightforward.
Sometimes, price stays inside the IB range, signaling indecision or consolidation, and sometimes we get fake breakouts before the real move happens. As a trader, it’s your job to sift through the noise and align yourself with the true direction.
The beauty of the IB is that it gives you structure and a clear game plan. You know that if price hasn’t broken the IB yet, the odds are in favor of it doing so at some point during the session. With that knowledge, you can be prepared to act when the moment arrives.
How to Use the IB in Your Trading
Let’s talk specifics. How exactly can you incorporate the IB into your trading strategy?
Mark the IB Range: During the first hour, you should be marking the high and low of the range on your chart. This is your "battle zone" for the day, and it will serve as your reference point for potential breakouts.
Analyze Volume and Price Action: Pay close attention to the volume and price action near the IB high and low. Are you seeing an increase in volume near these levels? Is price stalling or breaking through with conviction? These are the clues that will tell you whether a breakout is legitimate.
Identify Fake Breakouts: Not every IB break is a trade-worthy opportunity. One of the more common traps is the fake breakout—when price breaks above or below the IB only to reverse shortly after. You can often avoid these by waiting for confirmation, like a retest of the breakout level or significant volume on the break.
Set Targets and Manage Risk: Once price breaks the IB, it often moves to the next key level of support or resistance. You should have these levels mapped out in advance to set your target. Also, make sure your stop is placed sensibly—just inside the IB range works well if the breakout fails.
Case Study 1: Classic IB Breakout in the S&P 500 Futures (ES)
Let’s walk through a recent session in the S&P 500 futures market to illustrate the power of the IB.
On this particular day, the first hour of trading formed an IB between 5,460 and 5,485. For that first hour, price ping-ponged between these levels with no clear direction. This set us up perfectly for a breakout later in the day.
Now, here’s where patience pays off. About two hours into the session, we began to see increased volume as price approached the IB high of 5,485. Buyers were stepping in, and you could feel the pressure building. When price finally broke through the IB high, it was on strong volume, confirming that this wasn’t just a quick fakeout.
I entered long on the break with a target of 5,510—based on a previous resistance level from the daily chart. Sure enough, the price rallied strongly after the IB break, hitting my target for a clean, high-probability win.
This is the type of setup I love. It’s simple, it’s structured, and it works.
Case Study 2: Fake Breakout and Retest on the Nasdaq Futures (NQ)
Not every IB break is smooth sailing, and sometimes you’ll get fake breakouts that quickly reverse. Let’s look at how to handle these situations.
In a recent session on the Nasdaq futures (NQ), the first hour formed an IB between 19,600 and 19,700. A couple of hours into the day, price broke above the IB high, but something felt off. The breakout was on lower-than-expected volume, and price wasn’t moving with conviction.
I decided to sit on my hands and wait. Sure enough, price quickly reversed back into the IB range, confirming that this was a fake breakout. But here’s where it got interesting: After falling back into the range, price found support at the IB midline and started building momentum again. This time, when it broke above the IB high, it was with strong volume and price action. I entered long, and the trade hit my target at 19,750 shortly after.
Fake breakouts happen all the time, but if you wait for confirmation and don’t rush into trades, you’ll avoid unnecessary losses.
Expanding on the IB: Beyond Breakouts
The IB isn’t just about catching breakouts, though. There are a few other ways you can use this concept in your day trading:
Range Trading: On days where price stays within the IB range, you can use the IB high and low as natural support and resistance zones. If price rejects the IB high, for example, that can be a signal to short the market with a target near the IB low.
Measuring Extensions: Some traders use the IB to measure potential price extensions. A common technique is to take the range of the IB and project it above or below the IB high and low. For example, if the IB is 25 points wide, you can target an extension of 25 points above the IB high or below the IB low.
Midline Strategy: The midpoint of the IB (also known as the IB mid) can act as a pivot point throughout the day. If price breaks out of the IB, pulls back, and finds support at the IB mid, it’s often a strong confirmation of a continuation move.
A Few Extra Tips for Trading with the IB
Use Volume Profile for Confirmation: The volume profile is a great complement to the IB. When you see a price break above the IB high and volume is building above that level, it’s often a sign that the breakout has legs.
Don’t Overtrade: The IB is a great framework, but it won’t give you perfect setups every day. Stick to high-probability trades and avoid overtrading when the market is choppy or indecisive.
Keep an Eye on News Events: Major news or economic releases can skew the IB, leading to early or volatile breaks. On these days, be extra cautious and consider waiting for the news to settle before jumping into trades.
Wrapping It Up
The Initial Balance is one of those simple yet highly effective concepts that can give your trading structure and clarity. Whether you’re looking for breakouts or using the IB as a framework for range trading, it’s an invaluable tool for day traders.
The key takeaway here is patience. Let the market show its hand. Watch how price reacts around the IB, wait for confirmation, and stick to your plan. The IB might not give you a trade every day, but when it does, the setup is often clean and reliable.
As always, feel free to reach out if you’ve got any questions or thoughts on using the IB in your trading. I love hearing how these strategies are working for you and what you’re learning along the way. If you would like to learn more about TPO and Market Profile CLICK HERE.
Until next time—trade smart, stay patient, and together we will conquer the markets!
Ryan Bailey
VICI Trading Solutions