


Understanding Time Price Opportunity (TPO) Charts:
A Comprehensive Guide for Traders

Time Price Opportunity (TPO) charts are an essential tool for traders looking to gain deeper insights into market structure, value areas, and potential trade setups. While TPO and Volume Profile may seem similar, they offer distinct advantages and perspectives. In this blog, I’ll dive into the details of TPO charts, their key components, how they differ from Volume Profile, and how you can use TPO on different time frames to locate value.

(PIC BY SMASHELITO)
What is a Time Price Opportunity (TPO) Chart?
TPO charts, also known as Market Profile charts, were developed by Peter Steidlmayer to give traders a way to visually interpret market activity over time. A TPO represents the amount of time the market spends at a given price level, revealing areas of high and low market interest. This is different from a Volume Profile chart, which focuses on the amount of volume traded at each price level.
In TPO charts, each time period in the market (usually 30 minutes) is denoted by a single letter, such as "A" for the first period, "B" for the second, and so on. Each letter represents a block of time during which the market traded at a specific price level. As more letters accumulate at a particular price, it indicates that the market spent more time there, showing that the price had significance.

Key Components of TPO Charts
Value Area (VA)
- Value Area High (VAH): This is the upper boundary of the area where approximately 70% of the trading activity took place during a session. It represents the highest price of the range considered to be “fair value.”
- Value Area Low (VAL): This is the lower boundary of the value area, representing the lowest price within the 70% trading range.
- The Value Area itself gives you an idea of where the market is considering the price to be fair or balanced. Anything outside of this range might be considered overbought or oversold, potentially offering trading opportunities.
Point of Control (POC)
- The POC is the price level where the most time was spent during a session. This is crucial because the market typically gravitates towards this level, as it represents the price where buyers and sellers agree most on value.
- A significant aspect of the POC is that, as long as it's untested (i.e., the price hasn't returned to it), it often becomes a magnet for future price action. Traders see it as an area of interest, and price tends to revisit these points in the future.
TPO Periods
- The default period for each letter in a TPO chart is usually 30 minutes, meaning each letter (A, B, C, etc.) represents half an hour of market activity. This makes it easier to see the progression of time and price throughout a trading session.
- Different time frames, such as daily, weekly, and monthly TPOs, provide a broader or more focused view of value locations, helping traders understand where value is over varying periods.

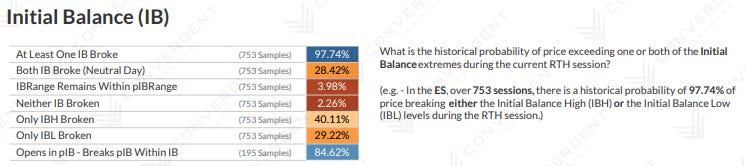
The Initial Balance (IB) in TPO Analysis: A Key Insight
The Initial Balance (IB) is a powerful tool in TPO analysis, representing the price range established during the first hour of trading. This early range provides a snapshot of how buyers and sellers are positioning themselves at the start of the day, and it plays a crucial role in determining potential price action for the rest of the session.
One of the key findings from a 3-year back-testing study reveals that the IB is broken 97% of the time during a trading day. This insight is invaluable to traders because if the IB hasn't been breached yet, there's a very high probability that it will be at some point before the session closes. This makes the IB a reliable target for breakout trades.
Here’s how traders use the IB in their strategies:
IB as a Target: If the market has not broken through the IB high or low during the session, traders can anticipate a potential movement towards one of these levels, using it as a target for intraday trades.
Predicting Market Movement: Knowing that the IB is broken 97% of the time, traders can gauge market behavior during quieter periods. If the price remains within the IB, it's likely building energy for a breakout later in the day.
Identifying Ranges and Trends: A breakout above or below the IB indicates whether the day may evolve into a trending day or if it will revert to the previous value area. The IB also serves as a natural reference point for planning trade entries and exits.
This statistical edge gives traders a framework for predicting price movements and helps manage risk by focusing on one of the most reliable aspects of intraday market behavior.
(Stats Provided by Convergent Trading)

How TPO Differs from Volume Profile
While TPO and Volume Profile seem similar in structure, they differ in one key aspect: TPO charts measure the amount of time the market spends at a price level, while Volume Profile measures the amount of volume traded at a price level.
TPO (Time-Based): Shows where price spent the most time. This is crucial for understanding how the market perceives value over time and helps in identifying areas of balance and imbalance.
Volume Profile (Volume-Based): Displays where the highest amount of trading volume occurred. This provides insights into the participation of larger players, like institutions, at certain price levels.
Why TPO is Significant for Traders
Identifying Value
- The key concept behind TPO charts is identifying where the market perceives value. By locating the Value Area High, Low, and POC, you can determine which price levels the market considers fair for buying and selling. This is especially useful when the market is transitioning from a trending phase to a more balanced phase (or vice versa).
POC as a Magnet
- The POC is often a point of interest that acts as a magnet for future price action. When a POC goes untested after a session, traders tend to watch for the market to revisit it in the future. This makes the POC a valuable level for planning re-entry points and trade setups.
Locating Imbalance
- When the market moves away from value areas and creates a long tail or single-print letters in the TPO, it can indicate a temporary imbalance. Such areas often result in swift price reversals or trend continuations. Knowing where these imbalances occur is crucial for both breakout traders and those looking to fade extreme moves.
Using TPO on Different Time Frames
TPO charts can be used on various time frames to give traders insight into where value lies across different horizons:
Daily TPO
- The daily TPO is useful for intraday traders looking to capture short-term moves. By analyzing daily value areas, VAH, VAL, and the POC, you can spot areas of interest for the current trading day. The POC from the prior day, for example, can serve as an initial magnet for price, while the value area boundaries can help you define potential support and resistance levels.
Weekly TPO
- Weekly TPOs provide a more extended view of value and are particularly helpful for swing traders. A weekly POC that aligns with a daily or monthly POC becomes a strong area of interest, offering a higher probability that the price may gravitate back to it. Weekly value areas offer insight into the broader market structure and can help traders assess whether the market is shifting from one value zone to another.
Monthly TPO
- Monthly TPOs give you an even broader perspective, often used by position traders. A monthly TPO chart will help determine if the market is in an overall accumulation or distribution phase. Monthly VAH, VAL, and POC levels are critical for setting long-term targets or understanding major trend shifts.

Trading Strategies Using TPO
Fade the Extremes
- When the market moves beyond the VAH or VAL, it could be an opportunity to fade the extreme price levels, anticipating a reversion back towards the POC. This strategy is particularly effective when the market has overextended itself or is in a range-bound state.
Breakout Trades
- If the price breaks out of the value area and finds acceptance (i.e., new TPO letters are forming in this area), this can signal the start of a new trend. A break beyond the VAH with sustained price action can indicate strength, while a breakdown below the VAL can suggest weakness.
POC Reversion
- When the market is trending, untested POCs from previous sessions act as potential targets for the market to revisit. Traders often look to enter positions as price approaches these POCs, anticipating either a reversion to value or a significant bounce.

Final Thoughts
TPO charts are a powerful tool for traders at any level, providing a detailed view of how price and time interact to reveal the market’s perception of value. Understanding TPO helps you identify high-probability trading areas, such as value areas and points of control, across daily, weekly, and monthly time frames.
By mastering TPO analysis, you can enhance your trading decisions, identify areas of interest for potential setups, and better understand market structure. Use this method as part of your daily routine, and you’ll begin to see the subtle but crucial insights it provides into market behavior.
For those of you new to TPO, I encourage you to start by applying it to your daily charts and slowly expand to weekly and monthly profiles. In time, you’ll see the significance of these value levels and how they can shape your approach to trading.
Feel free to reach out if you have questions or want further clarification on TPO charts. Let’s keep sharpening the edge together as we conquer the markets!"
Happy Trading!
Ryan Bailey
VICI Trading Solutions