Bitcoin has been the buzzword lately. Everyone wants in on the action. All the institutions have finally got their head out of their ass and have decided to double down on Bitcoin. Between the endless versions of ETFs and the institutional launch of other new products Crypto has exploded into the mainstream like never before.
During the bullcycle of 2021 we couldn't have been more excited to see BTC hit 65k. This was the first time that the dream of Crypto could be a reality in the mainstream. Then came a 2 year bear market. With that long bear market came an extensive accumulation period which led to a launch of not only bitcoin but many many ALT coins which have now already reached post bear market highs or some to even new ATHs.
There are endless Youtube videos and other information on the internet that you can do research regarding market cycles, fundamentals and on chain metrics like GlassNode to get a deeper understanding of what's going on behind the scenes. However there was one site that me and my team found an extremely interesting last bull run that had uncanny accuracy when it came to “market cycles” of BTC. The URL of the site is HERE and this site provides a ton of information from on chain metrics, Halving times and information, Cycle predictions, technical analysis indicators and also the Clown who calls himself “Plan B” (which I believe is an abortion pill..lol) who can't seem to get the prediction of the price right but is somehow famous for his system called “stock to flow”.
As I stated previously, one of my favorite features of this site is the “Cycle Repeat” and it gives predictions of where price will go and when with some how uncanny accuracy. Now I'm not saying it's perfect and you should NOT base your investments off it but based on the last bull cycle in my opinion it is worth paying attention to. My team and I watched this in amazement as this algo predicted the movement better than what we anticipated. The link to the “Cycle Repeat” is HERE and it's fun to watch and track, and I would recommend anyone who's following Bitcoin to bookmark this site.
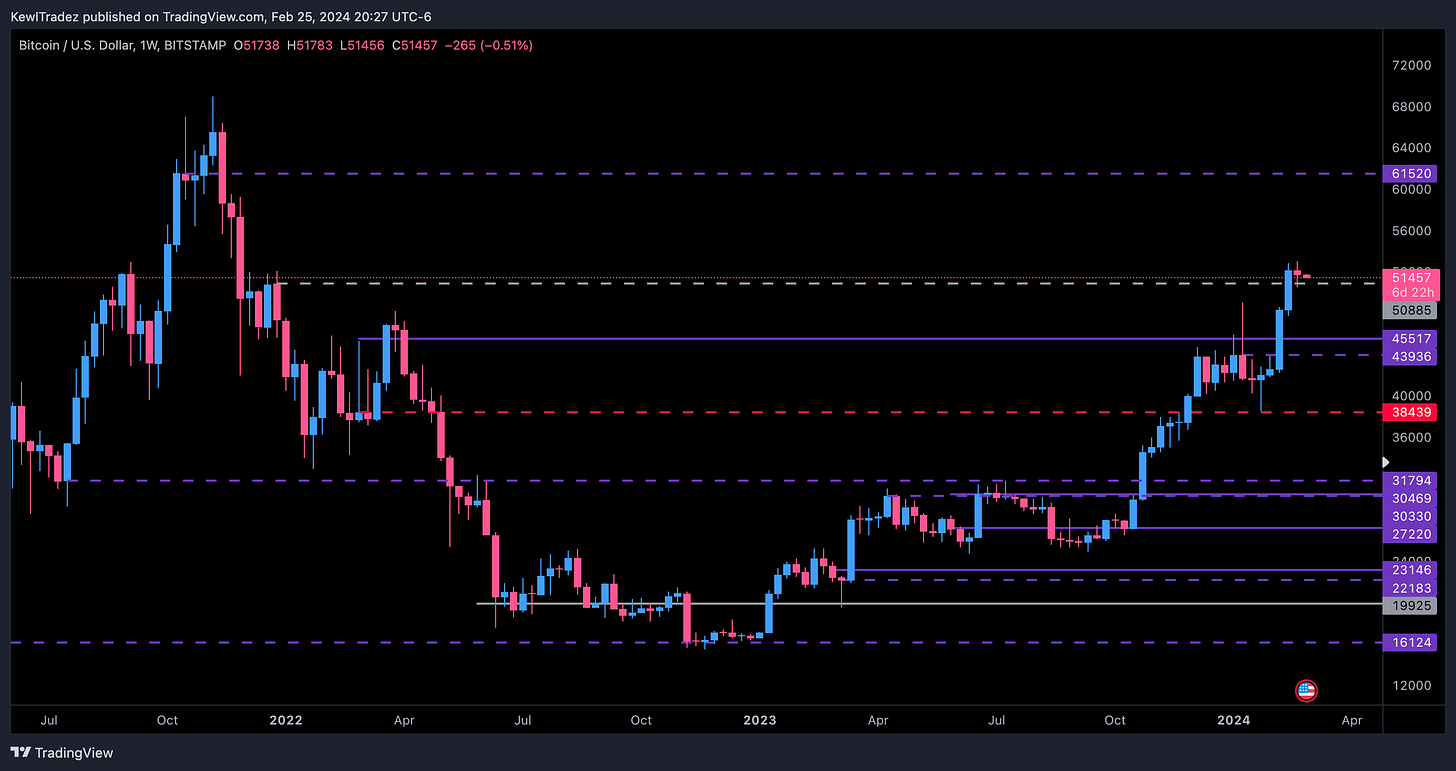
One of the things I found interesting is that it is calling this 51k area a temporary high and is calling for a pullback into the 31k ish area. Well after reviewing my charts That is the exact spot that i was also eyeing. That location has massive support that was left by 2 untested monthlies and a few weeklies that should provide excellent support as we approach this area.
Weekly Chart:
I have attached a copy of my chart and as you can see the 44k-ish area has quite a bit of support that could be an upset for this algos prediction that is very attractive & could provide nice support for more progression up. However if this area doesn't hold and we get under the significant weekly at 38,439 (Red Dash) then a trip into the 31800-29200 area is imminent and this area is littered with high time support that will provide an excellent buying opportunity in my opinion.
FOR TRADING VIEW USERS HERE IS A LINK TO MY CHART IM SHARING FOR YOUR REFERENCE
CLICK HERE TO SEE LIVE CHART
Daily Chart:
(For those of you who need a refresher of what the colors and lines mean on my chart you can reference the LEGEND “HERE” for clarity.)
I've been a huge advocate of BTC since 2016 and it has always been my belief that this is and will be the future of digital assets, and the newer version for the younger generation of digital gold. Regardless of what any algo says the price will be, Bitcoin has made its presence known in our lives and is now a household name and is clearly here to stay. With the next Halving right around the corner the idea is to work smarter not harder so take this resource I have provided and leverage its features to help you in your investment strategy.
I hope this information is one more tool in your toolbelt that will give you the edge to help you Conquer These Markets !!
Cheers !!
Ryan Bailey
AKA: Master Bailey 🙂


