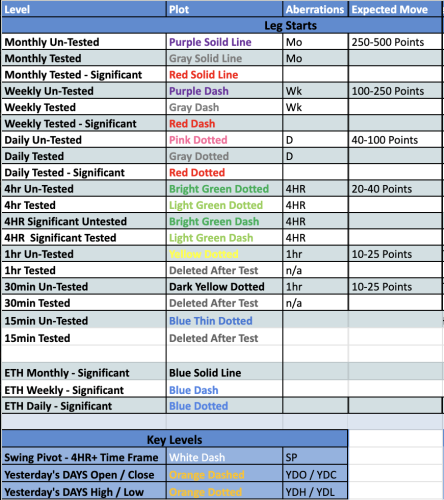
Welcome to the new folks who’ve joined us for the latest on Equity, Commodity, and Crypto markets! It’s time for a quick refresher on the chart legend that decodes the color scheme I use across all assets – crucial for making sense of my analysis.
I’m thankful you’re here, trusting my take on the markets. Over the years, I’ve crafted a method for spotting support and resistance that’s both sophisticated and straightforward. It’s all about risk management and making informed trades.
To keep it clear for everyone, my charts feature a consistent color coding. This is especially helpful for the new subscribers – I want you all to have the full picture.
Remember, the "Expected Move" part is mostly about the S&P 500 futures, the ES, my daily bread and butter. But the rule of thumb is universal: big time frames often mean bigger market moves.
I’m attaching the legend so you can reference it anytime. It’ll help you translate my chart colors into actionable insights, no matter the market.
If there’s anything unclear or you need a bit more guidance, don’t hesitate to reach out. Let’s get to those markets and make the most of our trades!
Important Disclaimer:
It's crucial to understand that I am not a licensed financial advisor. The trade setups I share are strictly for educational purposes ONLY. They are meant to supplement the ongoing learning of my students and all market enthusiasts. These are not recommendations for taking trades blindly. Instead, they are guides to aid your own research and decision-making process. You bear full responsibility for your trade research, execution, due diligence, and overall performance. By reading this, you agree to hold Vici Trading Solutions & Ryan Bailey harmless from any financial responsibility for trades presented here and acknowledge that this SubStack is solely for continued education, to be used for that purpose alone.
Ok now that we got that out of the way… Lets go Conquer these Markets !!


