


Weekend Review & What's Significant - ES Futures
Week of 9/21/2024

Happy Weekend Traders,
Last week brought a whirlwind of activity with plenty of volatility, fueled by the FOMC rate announcement and rollover. It was a unique week as we battled both the Fed’s decisions and the low-volume split between two contracts due to rollover. Despite the noise, the Fed delivered an early Christmas gift by lowering interest rates by 50 basis points, with a promise to reduce another 50 basis points before year’s end, totaling a 1% reduction in 2024. But that’s not all—the Fed has also committed to cutting another full 1% in 2025, with the potential for even more.
These lower interest rates are incredibly bullish for equities, and the Fed has given no cautionary reasons for concern. Inflation is approaching their 2% target, rates are at 5.5%, and job numbers remain relatively strong. Whether these cuts are politically motivated or not, what matters to us is clear: lower rates mean higher equities, as companies can borrow more cheaply to boost their bottom line.
With the Fed talking about rate cuts for the next 16-18 months, the bias is upward, and the charts are backing that up. Last week, we saw the market make two new all-time highs after the Fed’s announcement. The momentum is clearly with the bulls, and as traders, we don’t need to agree with the market’s rationale—we just need to trade the chart, and right now, the bulls are in control until proven otherwise.
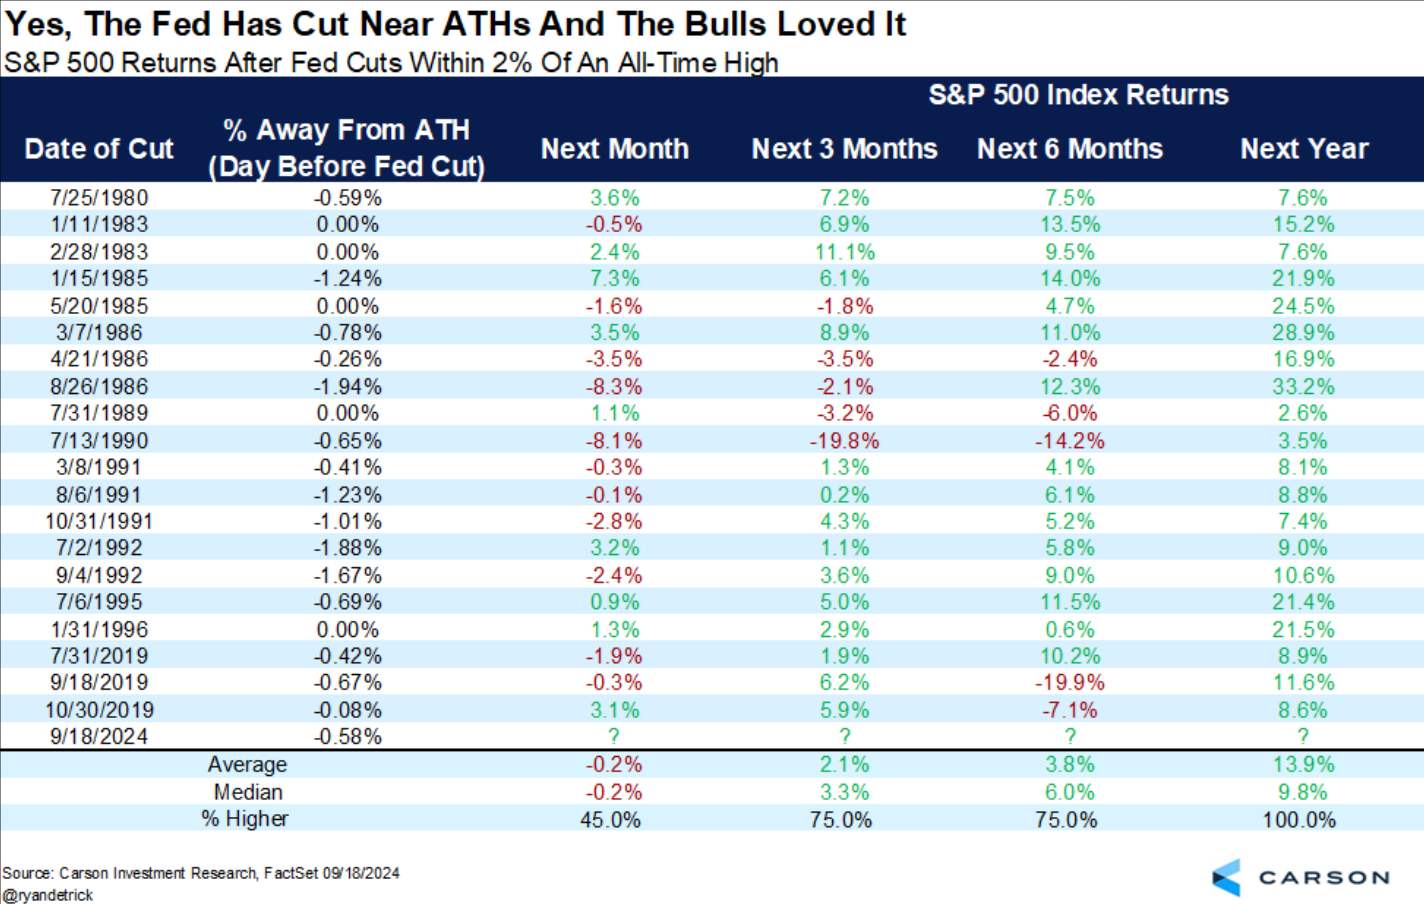
I wanted to share an interesting statistic. Historically, when the Fed cut rates while the market was less than 2% off all-time highs, the S&P 500 has been higher one year after each instance. While every situation is unique, this is a historical data point we should consider when making long-term trading decisions. This doesn’t mean we’ll buy recklessly, but the bullish chart and long-term data over the past two decades strongly suggest that we should be looking for buy opportunities.
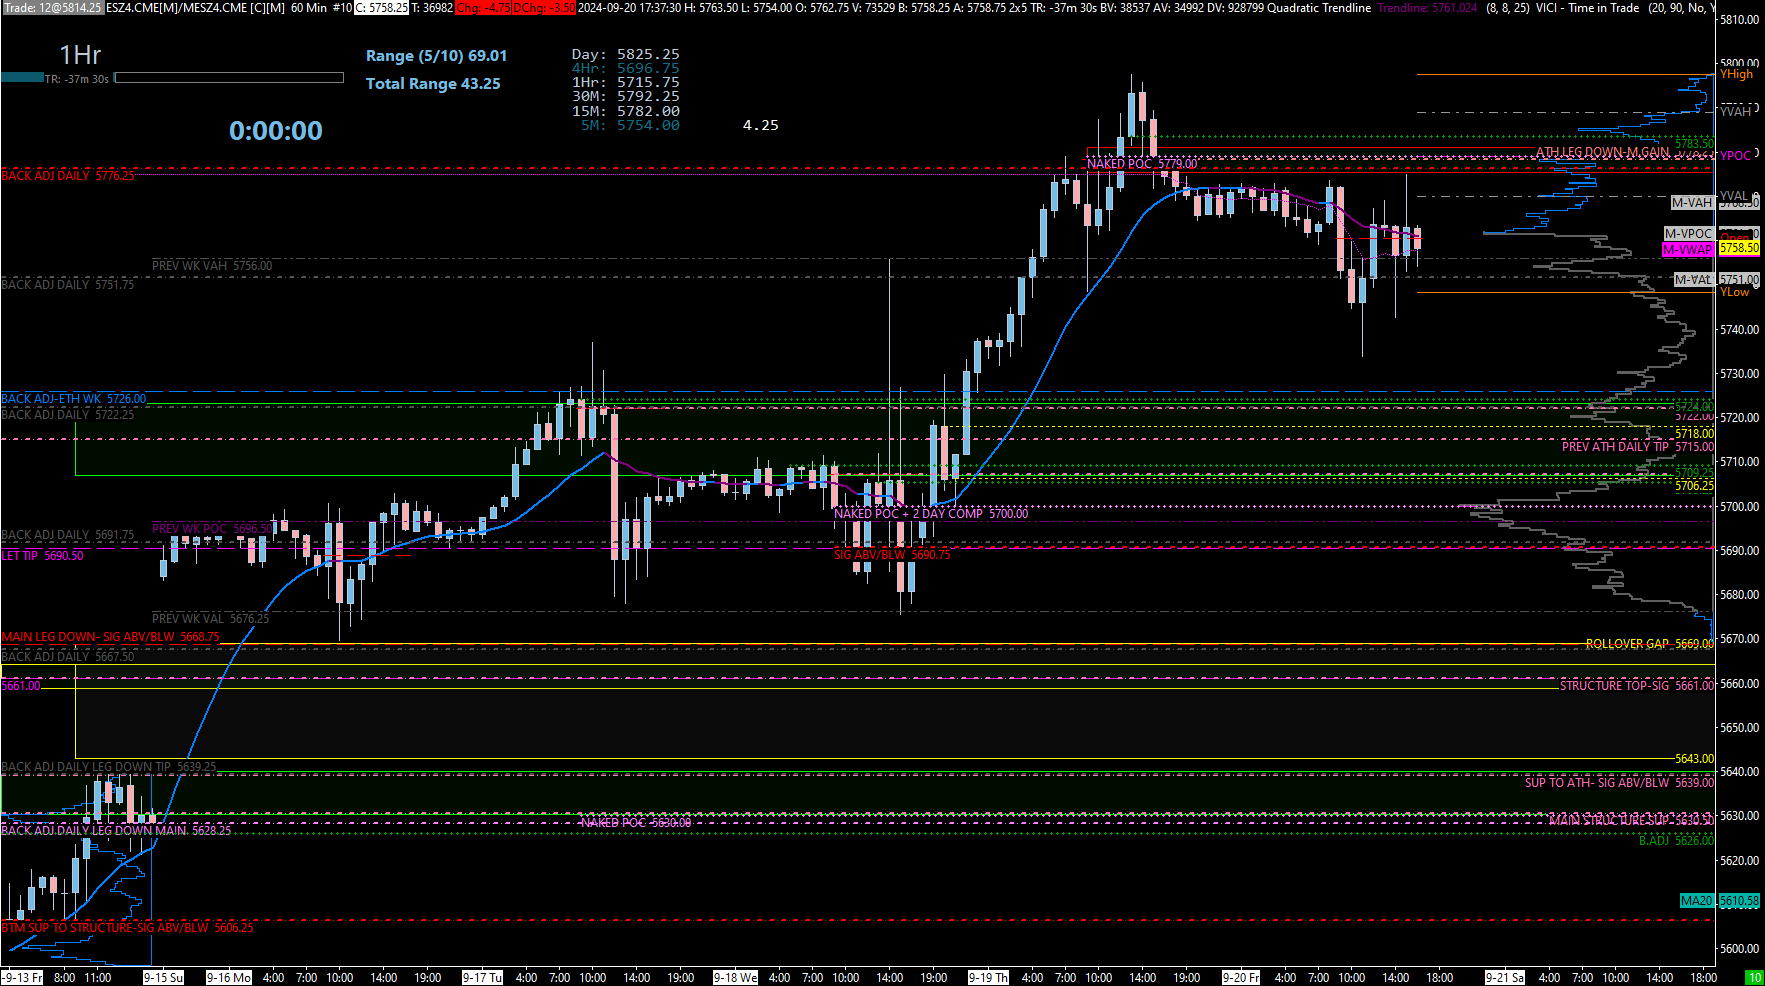
The ES is currently surfing all-time highs, with a strong bullish structure providing plenty of support for the continued move up. Even a 100-point pullback wouldn’t derail the bullish trend—it would actually be welcomed to bring in fresh buyers. The levels I’m focusing on today are back-adjusted weekly at 5726 and the daily level at 5707.25.
This zone is very attractive, with the lower area of 5709 to 5705.25 being the sweet spot. As long as the price holds above 5690.75, we’ll continue to push higher. However, if 5690 fails to hold, we could see a gap fill and test lower levels, such as the untested daily/weekly at 5661 or even the extremely attractive 5630.50-5626 zone, which stems from the massive three-week structure in August.
This 5630-5626 area would be a major level to watch if we dip lower. It not only completes the gap fill but also taps into a strong structure that could set up for a powerful continuation higher. However, if we test 5630, we need to see price regain 5686.75 and 5690.75 to reestablish bullish momentum.
In summary, for the CURRENT bullish structure to remain intact, we need to stay above 5690.75. HOWEVER The level to keep on your chart for a while will be the weekly level at 5668.75—this is the high timeframe line in the sand for bulls and bears alike and should be monitored like a hawk to gauge momentum when price gets above or below this level.
Trade Approach
For me, this market is currently long-biased only. While there will always be short scalp opportunities, the trend is clearly up. Support has been gained across all timeframes, and new buyers are likely to step in at each untested support level we approach. Unless we break below 5630, I’m looking to buy significant pullbacks and ride the trend with runners.
With the political landscape, including the upcoming elections, and the announced rate cuts on the horizon, we can expect higher equities going forward. That said, complacency is not an option—anything can happen in the markets. But based on current chart structure and the prevailing economic and political circumstances, the default direction for the S&P 500 is up.
I’ve included the key levels of significance in the charts below and highlighted the areas you’ll want to monitor closely for potential first-touch reactions.
Final Thoughts
We have a lot of red tag news coming up this week, which will certainly add to the volatility, so it’s important to stay patient, stick to the plan, and let the market come to us. This is not the time for reckless trading—follow the levels and let’s continue to ride this bullish wave.
Let’s conquer these markets together!
Ryan Bailey
VICI Trading Solutions
NEWS


LEVELS OF INTEREST

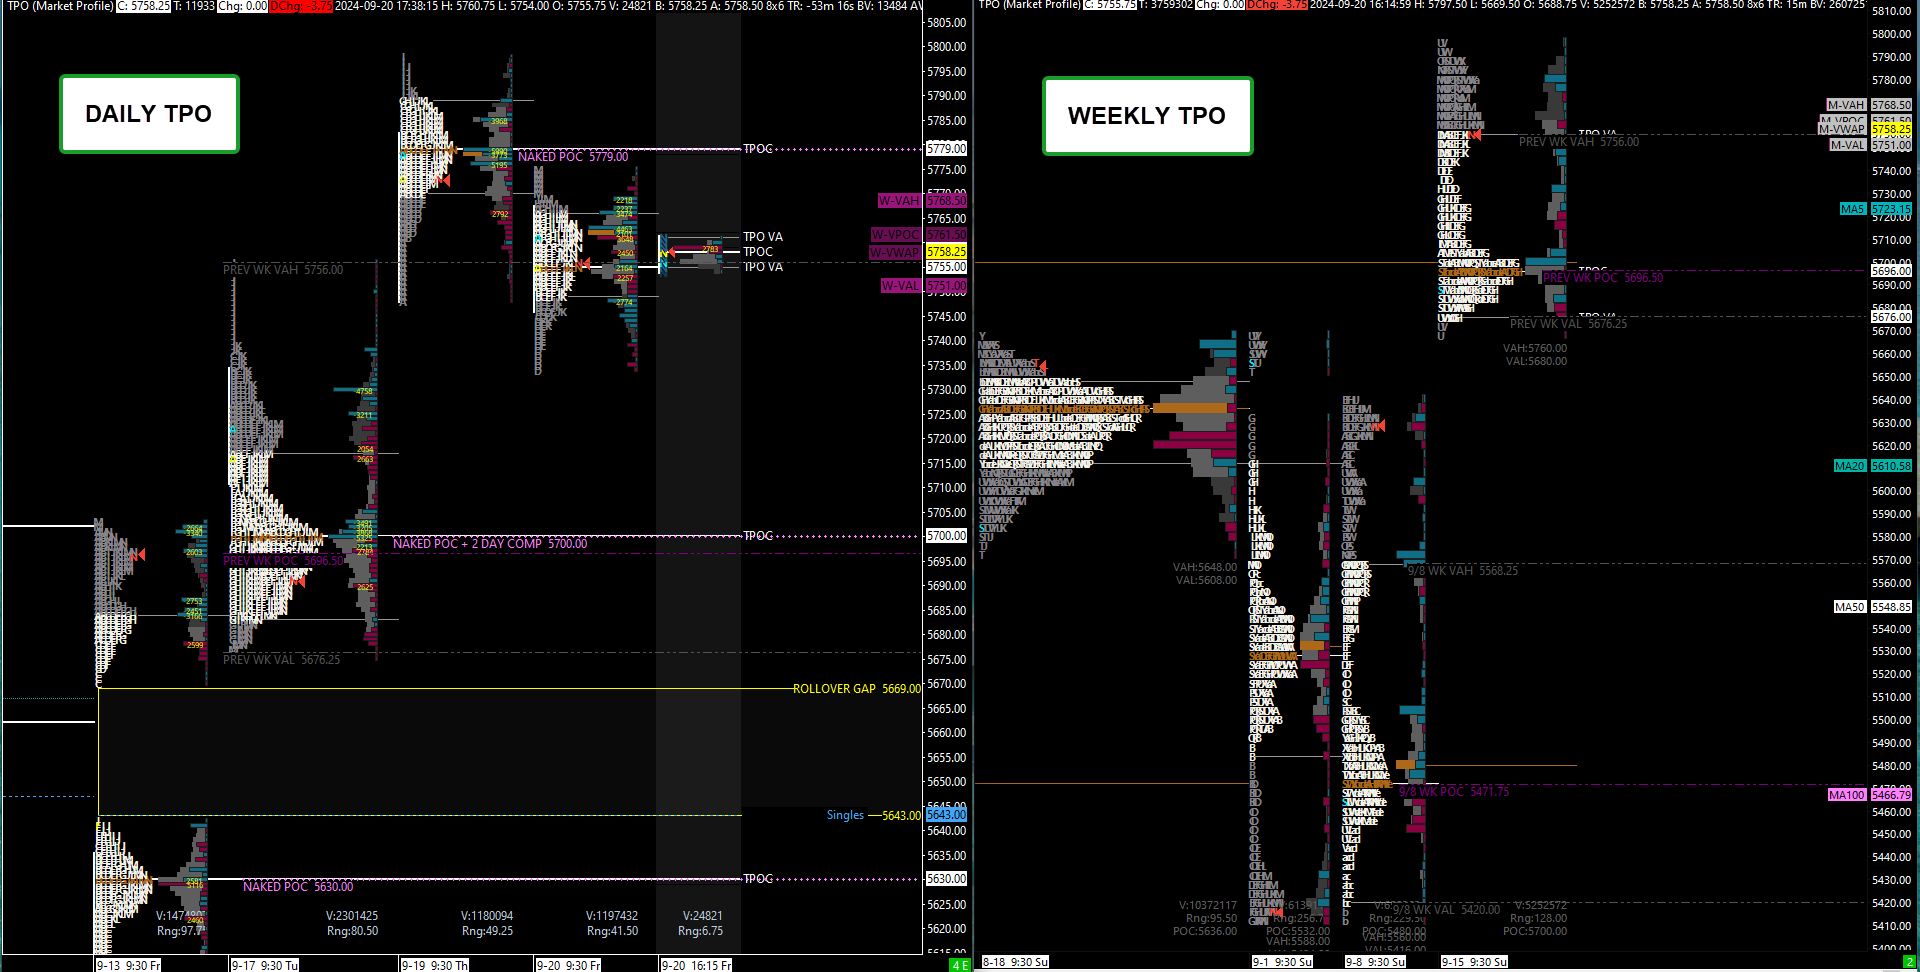
TPO PROFILES
WEEKLY/DAILY RTH CHARTS

RTH DAILY BACK ADJUSTED

4HR- Back Adjusted

4hr - Standard (Non Back Adjusted)

1hr - Standard (Non Back Adjusted)
WEEKEND REVIEW