The Initial Balance Strategy: How the First Hour Sets the Tone for Your Trades
A Day Traders Guide for the First Hour of Trading Known as the Initial Balance.
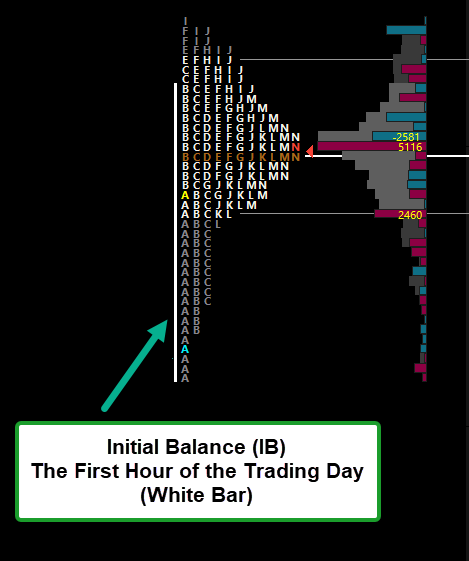
The first hour of trading is one of the most critical times of the trading day. This period, known as the Initial Balance (IB), sets the foundation for market direction, volatility, and key support and resistance levels. Understanding how the IB works can give traders a statistical edge, allowing them to anticipate market moves with confidence.
In this guide, we’ll break down:
✅ What the Initial Balance is and why it matters
✅ The three best strategies to trade the IB effectively
✅ How to use the IB to predict market direction
Let’s dive in.
What is the Initial Balance (IB) in Trading?
The Initial Balance (IB) is the price range established in the first hour of trading (9:30 AM - 10:30 AM ET in U.S. markets). The high and low formed during this period often act as key support and resistance levels throughout the day.
Why is the Initial Balance Important?
📌 Statistical Edge: The IB high or low gets broken 97% of the time based on three years of market data. This means that price almost always moves beyond this range.
📌 Market Structure: The IB helps determine whether the day will be range-bound, trending, or highly volatile.
📌 Institutional Activity: Large players often set their positions during this period, giving clues about market sentiment.
If you’re not watching the Initial Balance, you’re missing a powerful roadmap for the trading session.
3 Proven Initial Balance Trading Strategies
1. The IB Breakout Strategy (Best for Trend Days)
Since the IB is broken 97% of the time, one of the most straightforward strategies is trading the breakout.
✅ Setup: Wait for price to break above the IB high or below the IB low.
✅ Confirmation: Look for strong volume on the breakout to confirm institutional participation.
✅ Target: Use a measured move by projecting the IB range.
📌 Example: If the IB range is 20 points on the S&P 500 (ES Futures), a clean breakout could lead to a 20-point move in the breakout direction.
Tip: Avoid false breakouts by waiting for a 1-minute or 5-minute candle close outside the IB range.
2. The IB Fakeout Reversal (Best for Choppy Markets)
Not all breakouts succeed. Sometimes, price breaks the IB and then quickly reverses—trapping traders who chased the move.
✅ Setup: If price breaks the IB but fails to hold outside the range, consider taking the opposite trade.
✅ Confirmation: Look for a failed breakout candle or increased selling pressure on an IB high rejection.
✅ Target: A move back to the IB midpoint or the opposite extreme.
📌 Why it works: Big players often sweep liquidity beyond the IB before reversing the market.
Tip: If a breakout occurs on low volume, it’s more likely to be a fake move.
3. The IB Midpoint Reaction (Best for Range-Bound Days)
The 50% level of the IB range (midpoint) is a key pivot zone that often acts as intraday support or resistance.
✅ Setup: If price moves toward the IB midpoint, look for a reaction.
✅ Confirmation: Watch for volume spikes or reversal candles like pin bars.
✅ Target: A return to the IB high or low.
📌 Best used when: The market is consolidating, and price is bouncing between IB levels.
Tip: The IB midpoint also aligns well with Volume Profile POC (Point of Control), making it an even stronger level.
How to Use the Initial Balance in Your Trading Plan
The IB gives traders a structured framework to predict intraday movement. Here’s how you can use it:
📊 Trend Days: If price breaks the IB and holds, trade in the direction of the breakout.
🔄 Choppy Days: If price stays inside the IB, fade moves near the IB high and low.
📉 Reversals: If price fakes out above/below the IB and reverses, take the opposite trade.
Example: Trading the Initial Balance on ES Futures
The IB forms with a 30-point range from 9:30 AM - 10:30 AM ET.
Price breaks above the IB high with strong volume.
Using the measured move strategy, we target a 30-point move higher.
A clean breakout confirms a trending day, leading to a high-probability trade.
This is how professional traders structure their intraday setups—using the IB as a market blueprint.
PERSONAL PRO TIP: Due to the insanely high percentage rate of the IB High or Low getting broken at an outstanding 97%. I personally look for which side is the most likely to be broken given the days momentum and direction I will often use this as a target knowing that the probabilities of this being broken are extremely high.
Final Thoughts: Why You Should Be Watching the Initial Balance
If you’re serious about improving your trading consistency, understanding the Initial Balance is a must. It provides a clear framework for structuring trades, setting risk levels, and anticipating market moves.
But the IB is just one piece of the puzzle. If you want to dive deeper into market structure, check out my post on TPO (Time Price Opportunity) Charts. TPO helps visualize how the market builds value over time—giving you even more insights into price behavior.
Understanding Time Price Opportunity (TPO) Charts:
Time Price Opportunity (TPO) charts are an essential tool for traders looking to gain deeper insights into market structure, value areas, and potential trade setups. While TPO and Volume Profile may seem similar, they offer distinct advantages and perspectives. In this blog, I’ll dive into the details of TPO charts, their key components, how they differ…
Until next time—trade smart, stay prepared, and together we will conquer these markets!
Ryan Bailey,
VICI Trading Solutions
CLICK HERE TO JOIN OUR DISCORD COMMUNITY