Hello Traders,
In the world of trading, few things are more exciting than catching a breakout just as it happens. Spotting breakout patterns can be a powerful strategy for traders looking to capitalize on sudden, significant price movements. But as with all trading strategies, timing and execution are key. Today, we’re going to explore the art of spotting breakout patterns and how you can incorporate this strategy into your trading plan for maximum impact.
What is a Breakout?
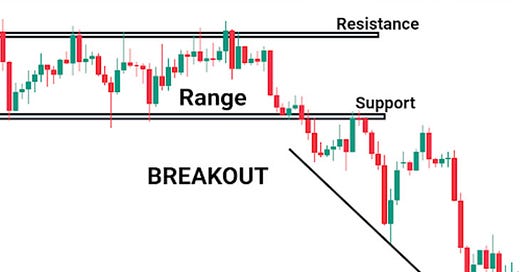
A breakout occurs when the price of an asset moves out of a defined range, often breaching a level of support or resistance. This movement signals that the asset is likely to continue moving in the direction of the breakout. Breakouts can happen in any market—stocks, forex, commodities, or cryptocurrencies—and they often precede significant price movements, providing traders with an opportunity to enter a trade at the early stages of a new trend.
Key Elements of a Breakout:
Support and Resistance Levels: The most common breakout points are support and resistance levels. Support is a price level where the asset has historically had difficulty falling below, while resistance is where it has struggled to rise above. A breakout occurs when the price breaks through one of these levels, indicating a potential shift in market sentiment.
Volume Confirmation: A key factor in validating a breakout is the trading volume. A breakout with strong volume behind it is more likely to be sustained, as it shows that there is genuine interest and participation in the move. Weak volume during a breakout can be a sign of a false breakout, where the price quickly reverses.
Chart Patterns: Breakouts are often associated with specific chart patterns, such as triangles, rectangles, head and shoulders, and flags. These patterns provide a visual framework that traders can use to anticipate breakouts and set entry and exit points.
Common Breakout Patterns
Understanding common breakout patterns can give you a significant edge in the market. Here are some of the most widely recognized patterns:
Ascending Triangle:
Description: This pattern forms when the price is making higher lows but meets resistance at the same level repeatedly. The upper resistance level remains flat, while the lower trendline slopes upward, creating a triangle shape.
Breakout Direction: Typically, the breakout occurs to the upside as the buying pressure increases, eventually pushing the price above the resistance level.
Descending Triangle:
Description: This is the opposite of the ascending triangle. Here, the price is making lower highs, but the support level remains flat. The upper trendline slopes downward.
Breakout Direction: The breakout usually occurs to the downside as selling pressure increases, driving the price below the support level.
Symmetrical Triangle:
Description: In this pattern, both the support and resistance levels are converging, forming a symmetrical triangle. The price is making both lower highs and higher lows.
Breakout Direction: The breakout can occur in either direction, depending on which trendline is breached. Traders often wait for the breakout to occur before taking a position.
Rectangle:
Description: The rectangle pattern forms when the price moves between parallel support and resistance levels, creating a horizontal trading range.
Breakout Direction: The breakout can be either upward or downward. Traders look for the price to break out of this range as an indication of a new trend.
Flag:
Description: A flag pattern is a short-term continuation pattern that forms after a sharp price movement. The flag resembles a small rectangle or parallelogram that slopes against the prevailing trend.
Breakout Direction: The breakout typically occurs in the direction of the preceding trend, continuing the movement.
How to Trade Breakouts
Spotting a breakout is one thing, but trading it effectively requires a well-thought-out strategy. Here’s a step-by-step approach to trading breakouts:
Identify the Setup:
Look for the formation of one of the breakout patterns mentioned above. Ensure that the price is approaching a key support or resistance level, and watch for signs of consolidation or narrowing price action.
Wait for Confirmation:
A breakout is more reliable when confirmed by an increase in trading volume. Avoid jumping in at the first sign of a breakout; instead, wait for the price to close beyond the support or resistance level with strong volume.
Set Your Entry Point:
Once you have confirmation, set your entry point just above the resistance level for a bullish breakout or just below the support level for a bearish breakout. This minimizes the risk of entering on a false breakout.
Place Your Stop-Loss:
Protect your trade by placing a stop-loss order just below the breakout point for long positions or just above it for short positions. This way, you limit your losses if the breakout fails.
Monitor the Trade:
After entering the trade, monitor it closely. Breakouts can lead to quick and significant price movements, so be prepared to take profits as the price reaches key targets, such as previous highs or lows.
Consider Scaling Out:
As the trade progresses, consider scaling out of your position by taking partial profits at predetermined levels. This helps lock in gains while allowing you to participate in further potential upside.
Conclusion:
Spotting breakout patterns is a fundamental skill for any trader looking to capture significant price movements. By understanding and recognizing key patterns, waiting for confirmation, and executing trades with a disciplined approach, you can increase your chances of success in the markets. Whether you’re a seasoned trader or just starting out, mastering the art of trading breakouts can be a valuable addition to your trading strategy.
As always, I encourage you to practice and refine your breakout trading techniques. Remember, consistency and discipline are the cornerstones of successful trading. Let’s continue to hone our skills and conquer these markets together!
Cheers,
Ryan Bailey
VICI Trading Solutions


