


S&P500 Trading Plan - ES Futures
10/9/2024 - Wednesday

Hello Traders!
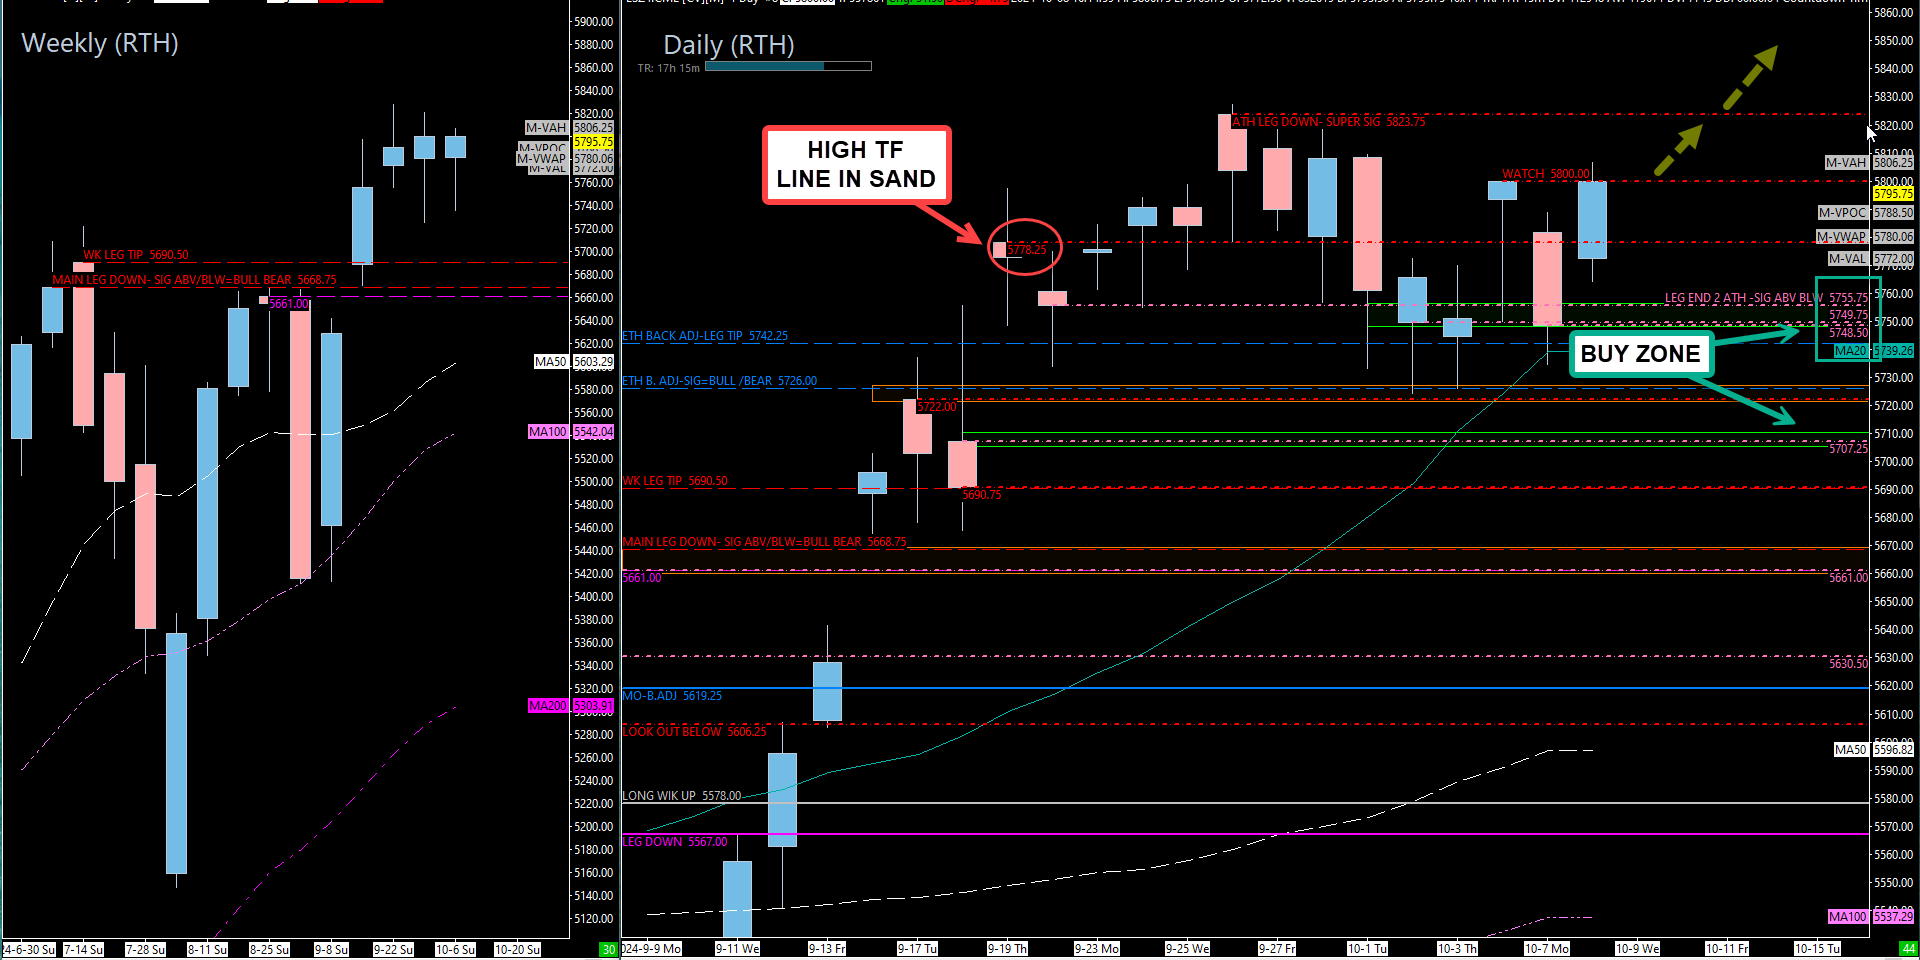
It looks like our plan played out perfectly today. As highlighted in yesterday’s outlook, as long as the 5726 weekly level held, the bulls would remain in control, and the overall bullish structure would stay intact. Last night, during the Globex session, price tapped this level perfectly and immediately regained Monday’s low. Once this low was secured and sellers couldn’t push price any further down, we were able to reclaim the 5755.75 daily level—our key above or below level—which put the ball squarely back in the bulls’ court.
By the time the regular trading session opened, we had already moved above 5763.75 and tested our 5770 level, which provided a temporary resistance. This reaction brought us back down to our significant 4-hour support at 5763.75, where price found acceptance and then launched to our upside target of 5800.
Tomorrow, we still lack any major red-tag news events that could bring significant volatility. However, we do have the FOMC meeting notes being released, which are a detailed summary of the recent 50-point basis rate cut. While this release could create minor volatility, I don’t expect any major market-moving surprises.
While the bulls are still holding control above 5726, it’s worth noting that despite the strong rally today, the daily timeframe has yet to regain full support after yesterday’s close. The question is whether the bulls have enough strength to continue pushing higher or if the bears will step in and seize control. Let’s take a closer look at the trade plan for tomorrow to see how we can navigate these key levels.
NEWS

Options VOL

Levels

Cheat Sheets:
Weekly/Daily TPOs

Weekly/ Daily RTH
4HR
1HR
Trade Plan:
Even though the theme here remains up, and we are clearly still trending higher despite being in a three-week balance area, I recommend leaning on the side of caution. Yes, we are holding 5726 weekly, which keeps us looking up by default, but I want to see confirmation on longs because the daily and 4-hour timeframes have not regained support even after today’s strong rally.
These two timeframes are crucial for understanding if support has been truly established. With that in mind, here’s the bullish and bearish case for tomorrow:
Bullish Case:
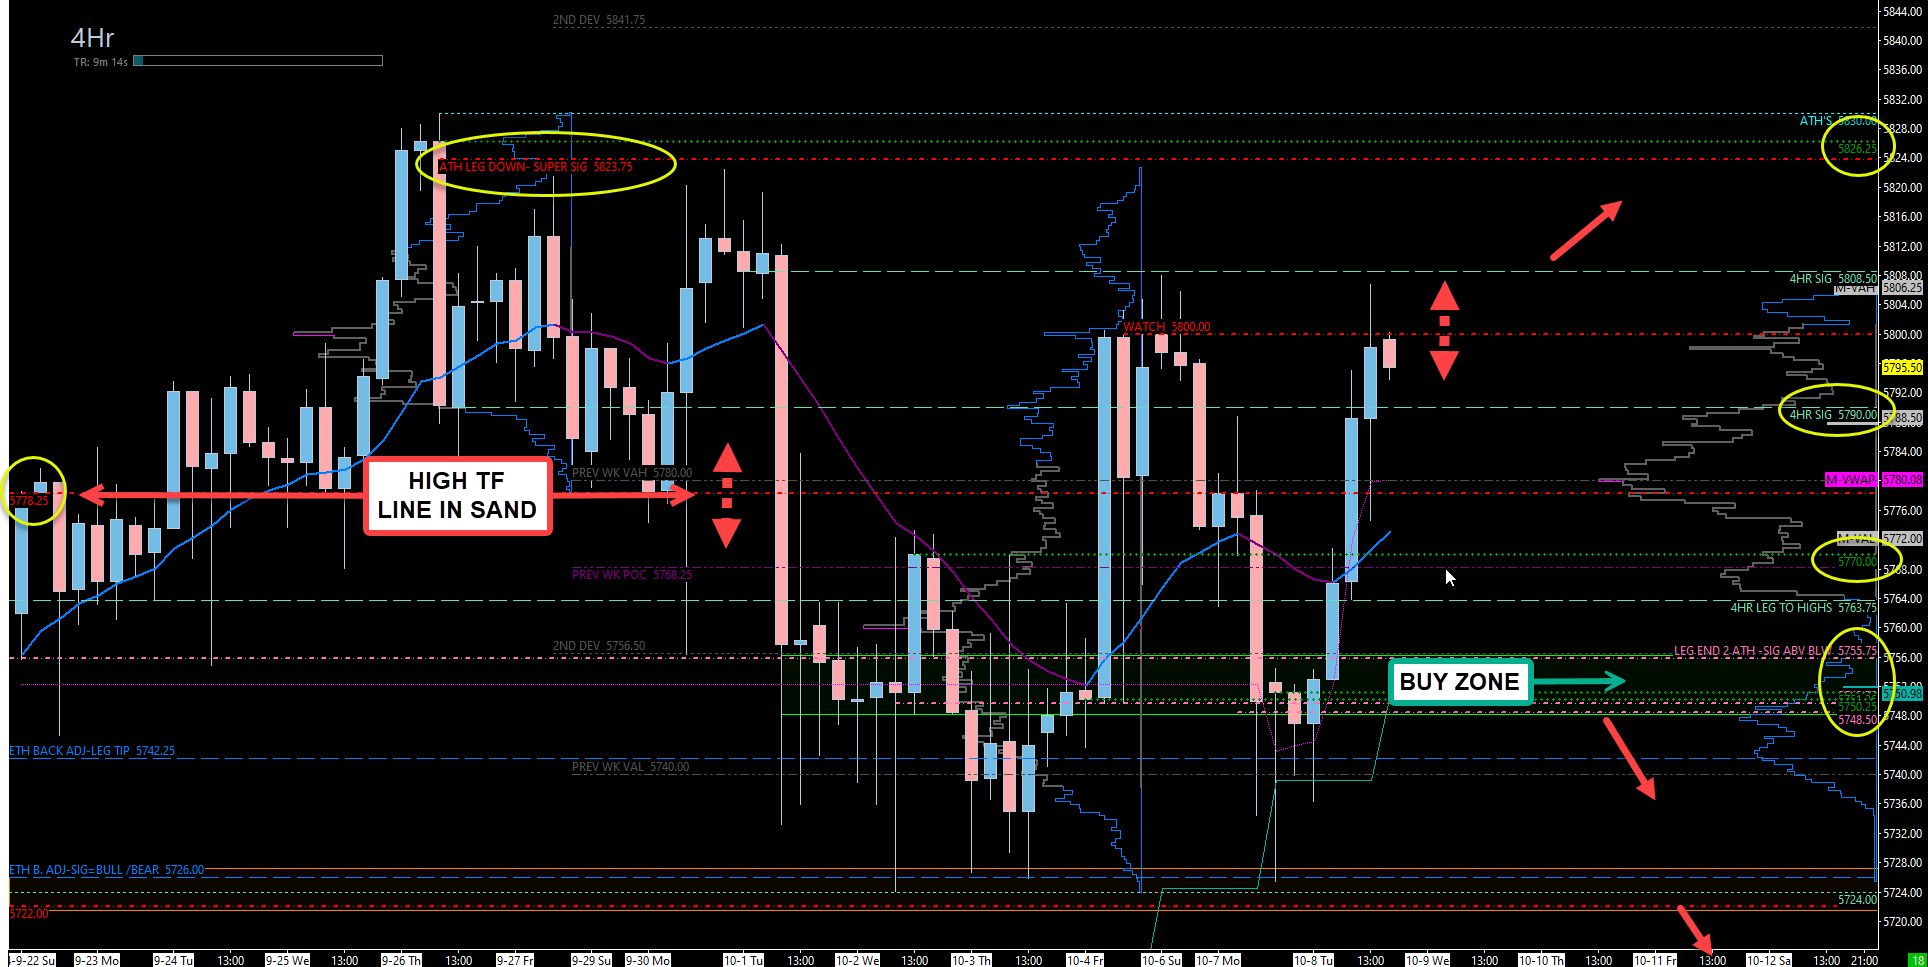
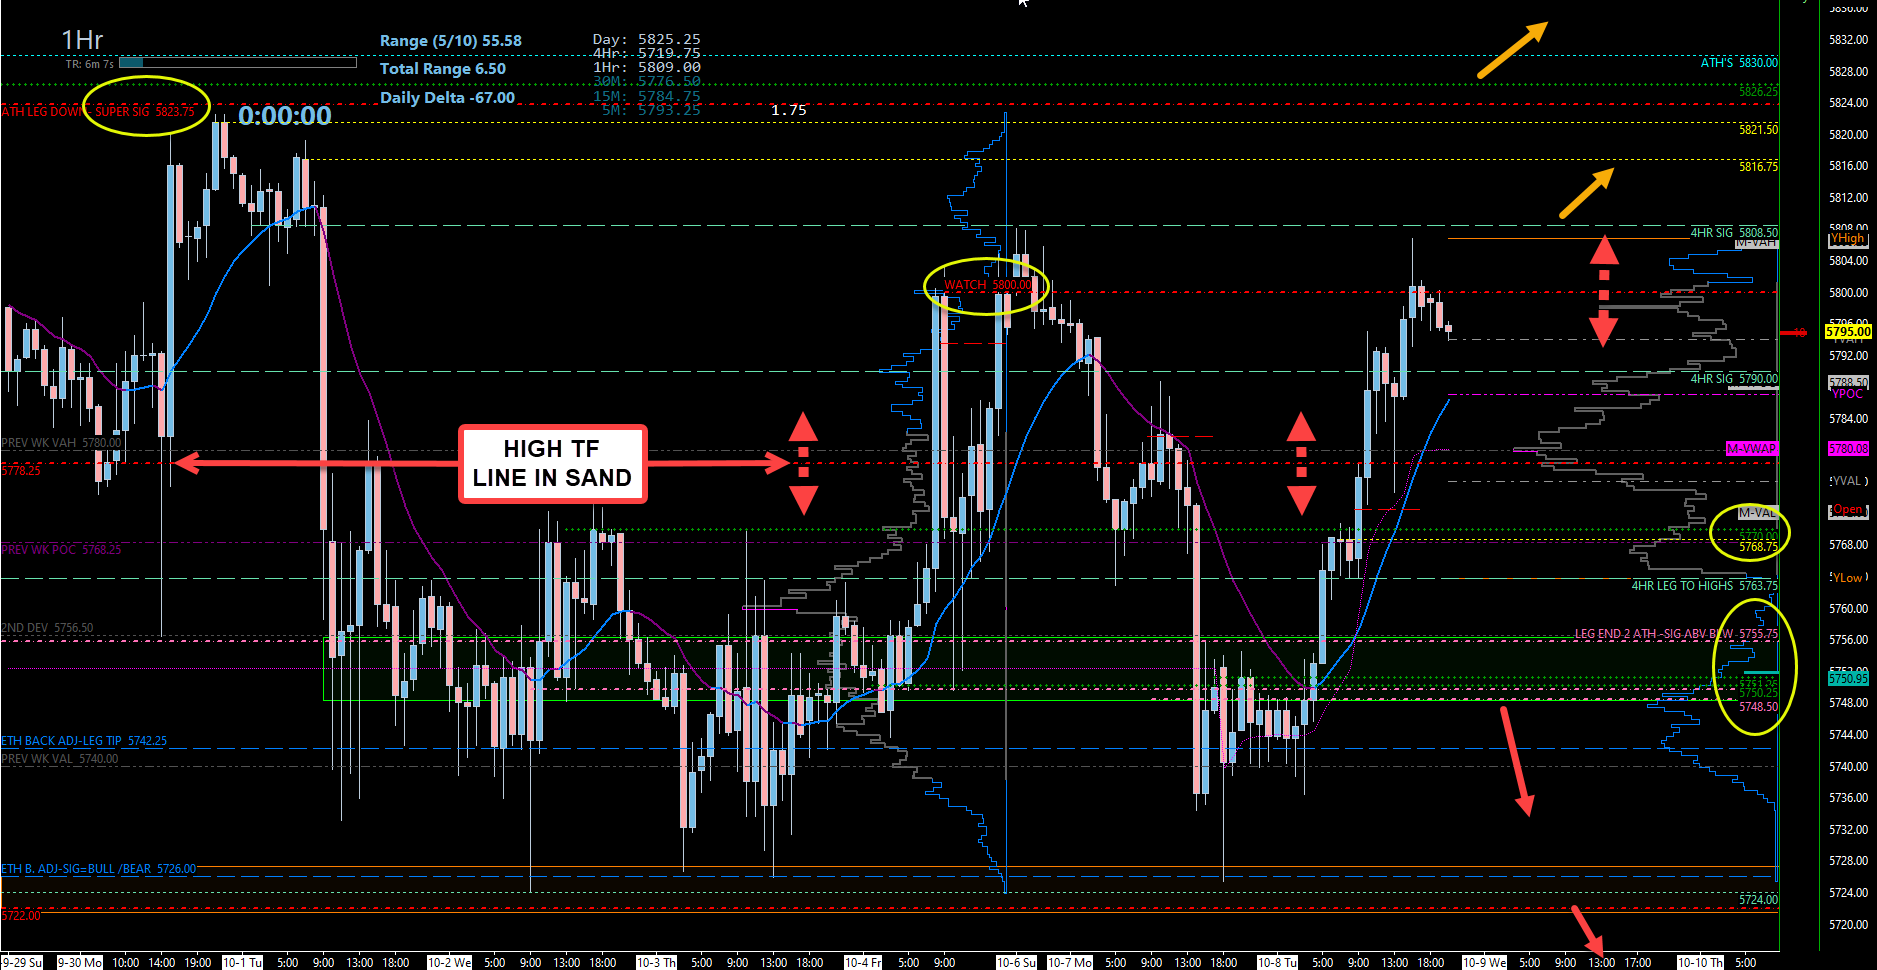
5790 (4-Hour Support):
This level is key for maintaining the immediate bullish structure. It aligns closely with yesterday’s POC at 5787, giving it strong context. However, given the large 50-point rally today, I would prefer to see a deeper pullback before looking for entries.5778.25 (Daily Level)/5780 (High Timeframe Line in the Sand):
This zone is our high timeframe line in the sand for gauging bullish or bearish momentum. Above this, we lean bullish; below, the bias shifts. Use this level as your context marker.5770 (4-Hour Level):
This untested 4-hour level has a lot of context, as it aligns with yesterday’s open and the previous weekly POC at 5768.25. If price comes down to this level, consider entering a long with a stop below the 4-hour low at 5763.75 for a solid risk-to-reward setup.5755.75 (Daily Level):
This level marks the daily leg to the previous all-time high and has now turned into a support level. If price pulls back here, I would look for a reaction on the first touch.5748.50-5751.25 (4-Hour/Daily Support Cluster):
This is a major support zone, combining multiple 4-hour and daily levels. If this area plays and holds, look for immediate acceptance back above 5755.75 for a continued move higher. A hold here could propel us much higher.
Bearish Case:
If 5748.50 doesn’t hold, things could start to get ugly fast. We would likely slide down to 5726 weekly, which has been tested numerous times. I wouldn’t expect it to hold again under heavy pressure.
Below 5726, watch the following levels:
5722 (Daily Level):
The next immediate support after 5726. Losing 5722 could lead to a quick drop into the 5709-5705 zone.5709-5705 (4-Hour/Daily Combo):
This zone needs to hold and see a quick reclaim of 5726 for bulls to regain control. If we fail to reclaim and drop below 5709, the move lower could accelerate rapidly.5690 (Weekly Leg Tip):
A sustained break below 5690 would suggest a shift in momentum to the bears.5668.75 (Major Bull/Bear Line):
This is the major bull/bear line for a sustained move higher or lower. Losing 5668.75 would fully shift momentum into the bears’ hands.5661 (Daily/Weekly Combo):
If price reaches this level, we need to see an immediate reclaim of 5668.75. Failure to reclaim would indicate a catastrophic breakdown for the bullish trend.
Final Thoughts:
The key takeaway is that 5726 remains the most critical level on the chart. If this holds, we continue to look for bullish opportunities. However, if it breaks, the momentum could quickly shift in favor of the bears. Stay focused, manage your risk, and look for confirmation before jumping into trades.
Let’s stay sharp and conquer these markets together!
Ryan Bailey
Vici Trading Solutions