


S&P500 TRADING PLAN: ES FUTURES
10/22/2024 - Tuesday

Hello traders,
Our plan played out perfectly again today! If you followed the plan from yesterday’s Outlook, you should have capitalized on the volatility. The 5908 daily resistance level provided a fantastic short opportunity, driving price down to the 5868 4-Hour level, which we identified as a potential support zone. Once price recovered 5875, it was clear the bulls were ready to take control again, offering a nice 30-point squeeze to the upside.
Now, the question is, will the bulls continue to control the action, or are we starting to see signs of weakness? Tomorrow’s trading might offer more clues—read on for the critical levels and trade plan below.
NEWS

OPTIONS VOL
LEVELS

CHEAT SHEETS:
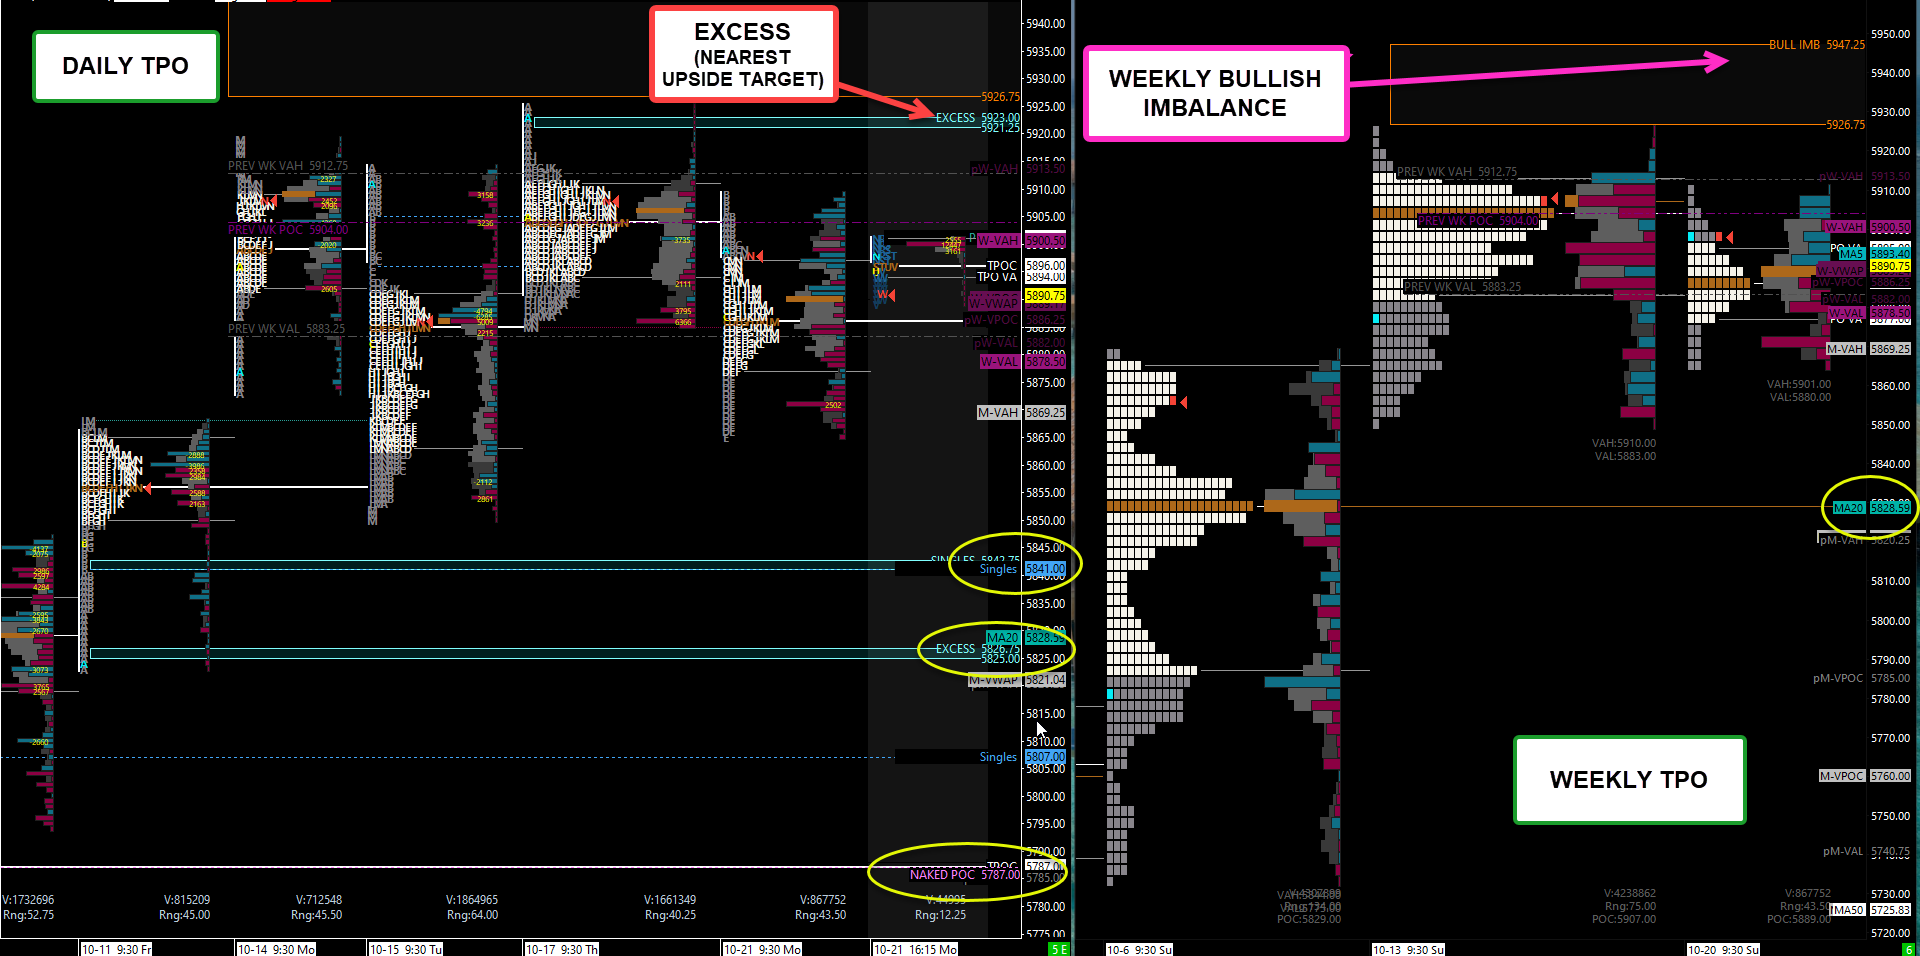
DAY/WK TPO
WK/DAY

4HR

1HR

Trade Plan:
Even though no red tag news events are scheduled, we learned on Monday that volatility can appear at any moment. As always, we need to stay prepared for any scenario.
While the market remains bullish, cracks are starting to show. Dojis on the daily chart and lower lows testing key support levels indicate some weakness. A sustained move above 5908 will be critical for continued upside. However, failure to reclaim it could trigger further downside. Below 5887, the market could trend downward toward our critical support zones.
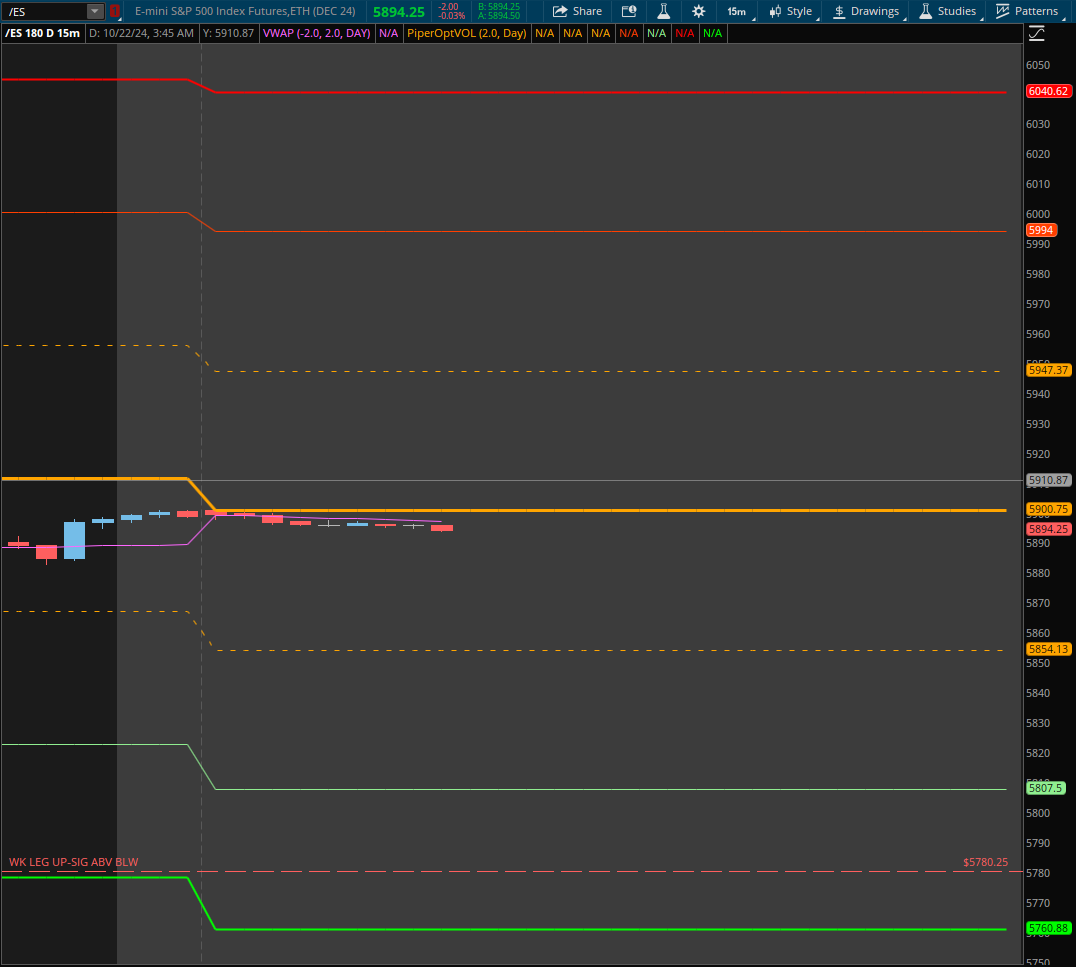
Upside Levels to Watch:
5908 (Daily Level):
A break above this level could extend the bullish move. However, two untested levels directly above—5918.75 (4-Hour) and 5923 (Daily Level)—could cause a reaction. Be prepared for potential pullbacks if these levels are reached.Unrepaired Bullish Imbalance:
The market still carries a bullish imbalance that needs to be addressed. There’s no specific timeframe for when this structure will resolve, but it remains on our radar for a potential continuation higher once the imbalance is repaired.
Critical Support Zones:
5887 (Daily Level):
This key level has been used for multiple tests, serving as a guide for being above or below. Monday’s POC also aligns here.5868/64 (4-Hour Level):
Tested support to our current ATH a move below this could send us lower into the 5853.50 4hr fairly rapidly.5853.50 (Significant 4-Hour Level):
Previously a launching point to ATHs, this level will be critical. If it fails, expect a move toward 5840.75 - 5839.75 (1-Hour Cluster).
Additional Key Levels:
5840.75 - 5839.75 (1-Hour Cluster):
This zone cleans up single prints on the profile. If a reaction occurs here, an immediate reclaim of 5853.50 will confirm upside continuation.5829.25 (4-Hour) / 5823.75 (Daily) / 5828 (POC):
A high-confluence zone with untested POCs. A failure at 5823.75 will shift momentum to the downside.5802 - 5798.25 (4-Hour Cluster):
A solid entry point for long setups. If this area holds, look for a reclaim of 5813.25 and 5823.75 to confirm further upside.
Bearish Case:
If 5748.50 fails, expect a sharp move toward the major weekly support at 5726. Here’s what to monitor:
5726 (Weekly Level):
Tested several times but may not hold again under heavy selling pressure.5722 (Daily Level):
Losing this level could quickly lead to the 5709 - 5705 zone.5709 - 5705 (4-Hour/Daily Combo):
Bulls need to reclaim 5726 quickly if tested. Failure to do so could accelerate the decline.5690 (Weekly Leg Tip):
A sustained break below 5690 suggests a shift toward bearish sentiment.5668.75 (Major Bull/Bear Line):
This is the critical line in the sand between bullish continuation and bearish momentum.5661 (Daily/Weekly Combo):
If tested, a quick reclaim of 5668.75 is necessary to prevent further breakdowns.
Key Takeaways:
I DO NOT HAVE ANY UNTESTED LEVELS AT THIS MOMENT BELOW 5887.75. MY ONLY UNTESTED LEVELS FOR LONGS BEGIN AT 5840.75. THIS IS VERY IMPPRTANT TO NOTE BECUSE IF THE MARKET BREAKS IT COULD DO SO SWIFTLY AND WITHOUT WARNING.
Critical Support Levels: Monitor 5780, 5823.75, and 5853.50 closely.
Buy Zone: The 5755.75 - 5748.50 area is a high-probability support zone. A hold here would signal potential for another push to new all-time highs.
Bullish Bias: As long as 5853.50 holds, the bullish momentum remains intact. A break below 5823.75 will shift momentum to the downside.
Upside Targets: Watch for reactions at 5918.75 (4-Hour) and 5923 (Daily) levels. If these levels are cleared, we could see further progress toward resolving the bullish imbalance.
Stay sharp, follow the plan, and together, let’s conquer these markets!
Ryan Bailey
Vici Trading Solutions