


S&P500 Trading Plan - ES Futures
10/15/2024

Hello Traders,
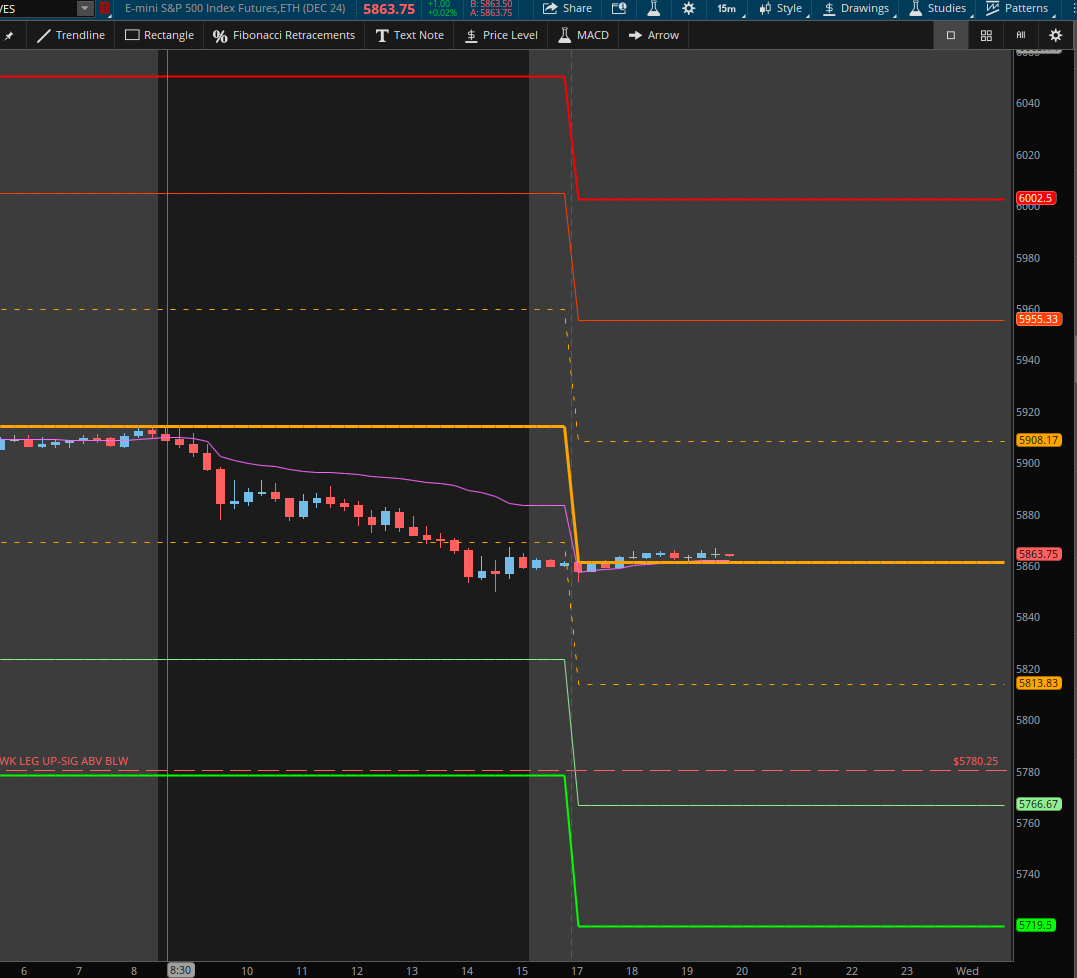
We finally got our pullback today, resulting in a nice spill from the top. The support levels we highlighted in yesterday’s outlook at 5880 and 5853 held perfectly. The 5853.50 level provided the first real support since we lost 5908, making it a key level moving forward.
We will now use 5853.50 as a primary marker while we remain in this price range. Monitoring whether we stay above or below this level will help us gauge momentum. With thin volume still present, it’s essential to stay flexible. Below, I’ve outlined the trade plan and key levels to watch for tomorrow.
NEWS
Options VOL
Levels

Cheat Sheets
WK / DAY TPO

Weekly /Daily
1HR

Trade Plan
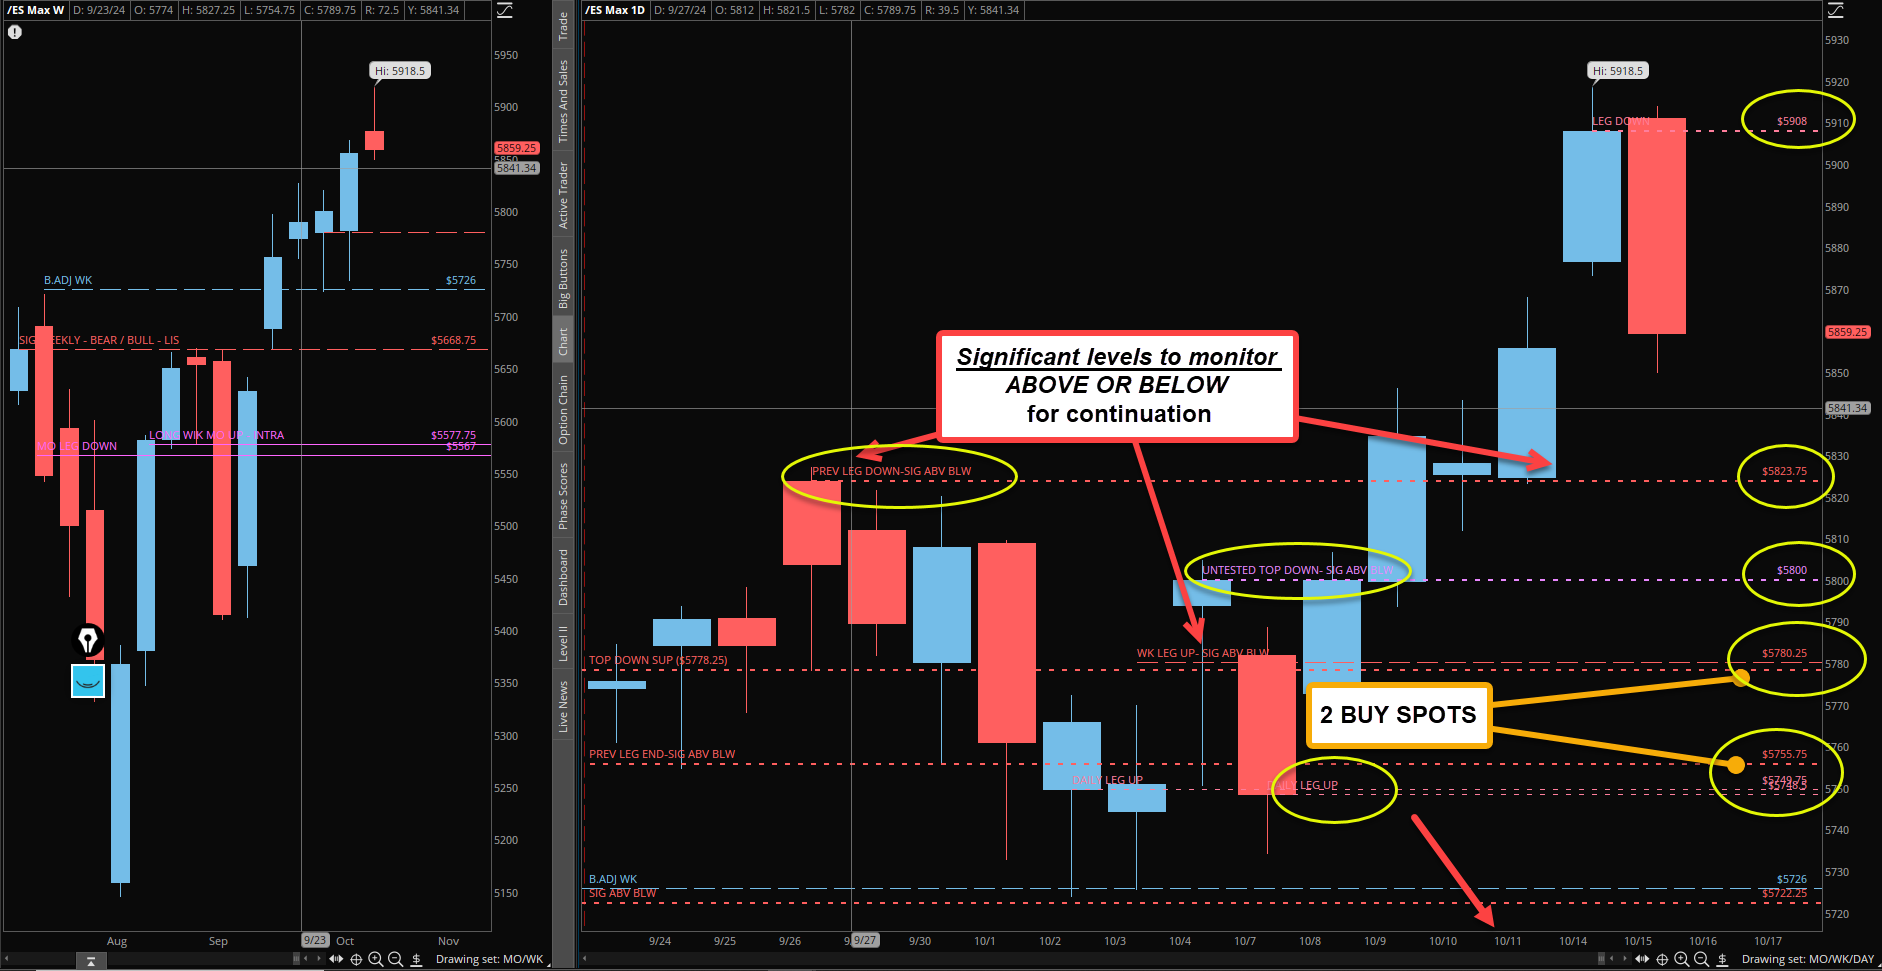
As long as we remain above 5853.50, there’s potential to move back higher and retest previous highs. However, if we lose 5853.50, watch for a decline toward our key buy zones between 5829 and 5823.75. The 5823.75 daily level will act as an important momentum marker—if we fall below it, we could shift back into the previous leg down, setting the stage for a potential breakdown.
Key Levels to Watch:
5829.25 (4-Hour) / 5823.75 (Daily) / 5828 (POC):
This is a critical confluence zone with Friday’s POC and the previous weekly POC aligning here. The 5823.75 daily level will act as our above/below marker. Expect a strong reaction if price tests this area.
5802-5798.25 (4-Hour Cluster):
This zone includes an Untested Daily @ 5800 and is a prime spot for a long entry on the first touch.
5813.25 (4-Hour Level) & 5808.50 (4-Hour Level):
The 5813.25 level has been tested multiple times and may not hold again. If 5808.50 plays, look for an immediate reclaim of 5813.25 and a push back to 5823.75 to confirm continued upside.
5788.25 (4-Hour Level) & 5786.50 (1-Hour Level):
This is a high confluence zone with the naked POC and the current week’s POC.
If 5788.25 plays, look for a reclaim of 5794 (yesterday’s low) and a quick move back above 5800.
5780 (High Timeframe Line in the Sand):
As long as price holds above 5780, the bullish trend remains intact.
Untested Areas to Watch:
5770 (4-Hour Level) & 5768.75 (1-Hour Level):
These levels remain untested and could provide a reaction. Stops should be placed below 5763.75, which has been a critical support level for the past two weeks.
5755.75 (Daily Level) & 5750 (Support Cluster):
This is the new daily leg up and should provide a strong reaction on the first touch. Stops for this zone should be placed below 5742.
Bearish Case:
If 5748.50 fails to hold, we could see a quick slide to the major weekly level at 5726. Here’s what to monitor on the downside:
5726 (Weekly Level):
This level has held several times, but a retest under heavy pressure may result in a breakdown.
5722 (Daily Level):
Immediate support following 5726. Losing 5722 could lead to a quick drop into the 5709-5705 zone.
5709-5705 (4-Hour/Daily Combo):
Bulls need to reclaim 5726 quickly if this zone is tested. Failure to do so could accelerate the move lower.
5690 (Weekly Leg Tip):
A sustained break below 5690 would signal a momentum shift to the bears.
5668.75 (Major Bull/Bear Line):
This is the bull/bear line for a sustained move higher or lower. Losing 5668.75 would fully shift momentum into the bears’ hands.
5661 (Daily/Weekly Combo):
If price tests this level, an immediate reclaim of 5668.75 will be necessary to prevent further breakdowns.
Key Takeaways:
Critical Support Levels:
5780, 5823.75, and 5800 are crucial levels to watch for momentum shifts.
Buy Zone:
The 5755.75-5748.50 zone should provide a solid reaction if tested. If this zone holds, expect a continued rally to new highs.
Bullish Bias:
As long as 5853.50 holds, the bullish momentum remains intact. However, losing 5823.75 could shift momentum lower.
Stay sharp, stick to the plan, and together, let’s conquer these markets!
Ryan Bailey
Vici Trading Solutions