


S&P500 TRADING PLAN: ES FUTURES- PPI EDITION
11/14/2024 - THURSDAY

Hello Traders,
Today’s CPI data delivered exactly the volatility we anticipated, opening within yesterday’s range and keeping us there for most of the day, making directional moves tricky.
(Excerpt from YDays Plan)
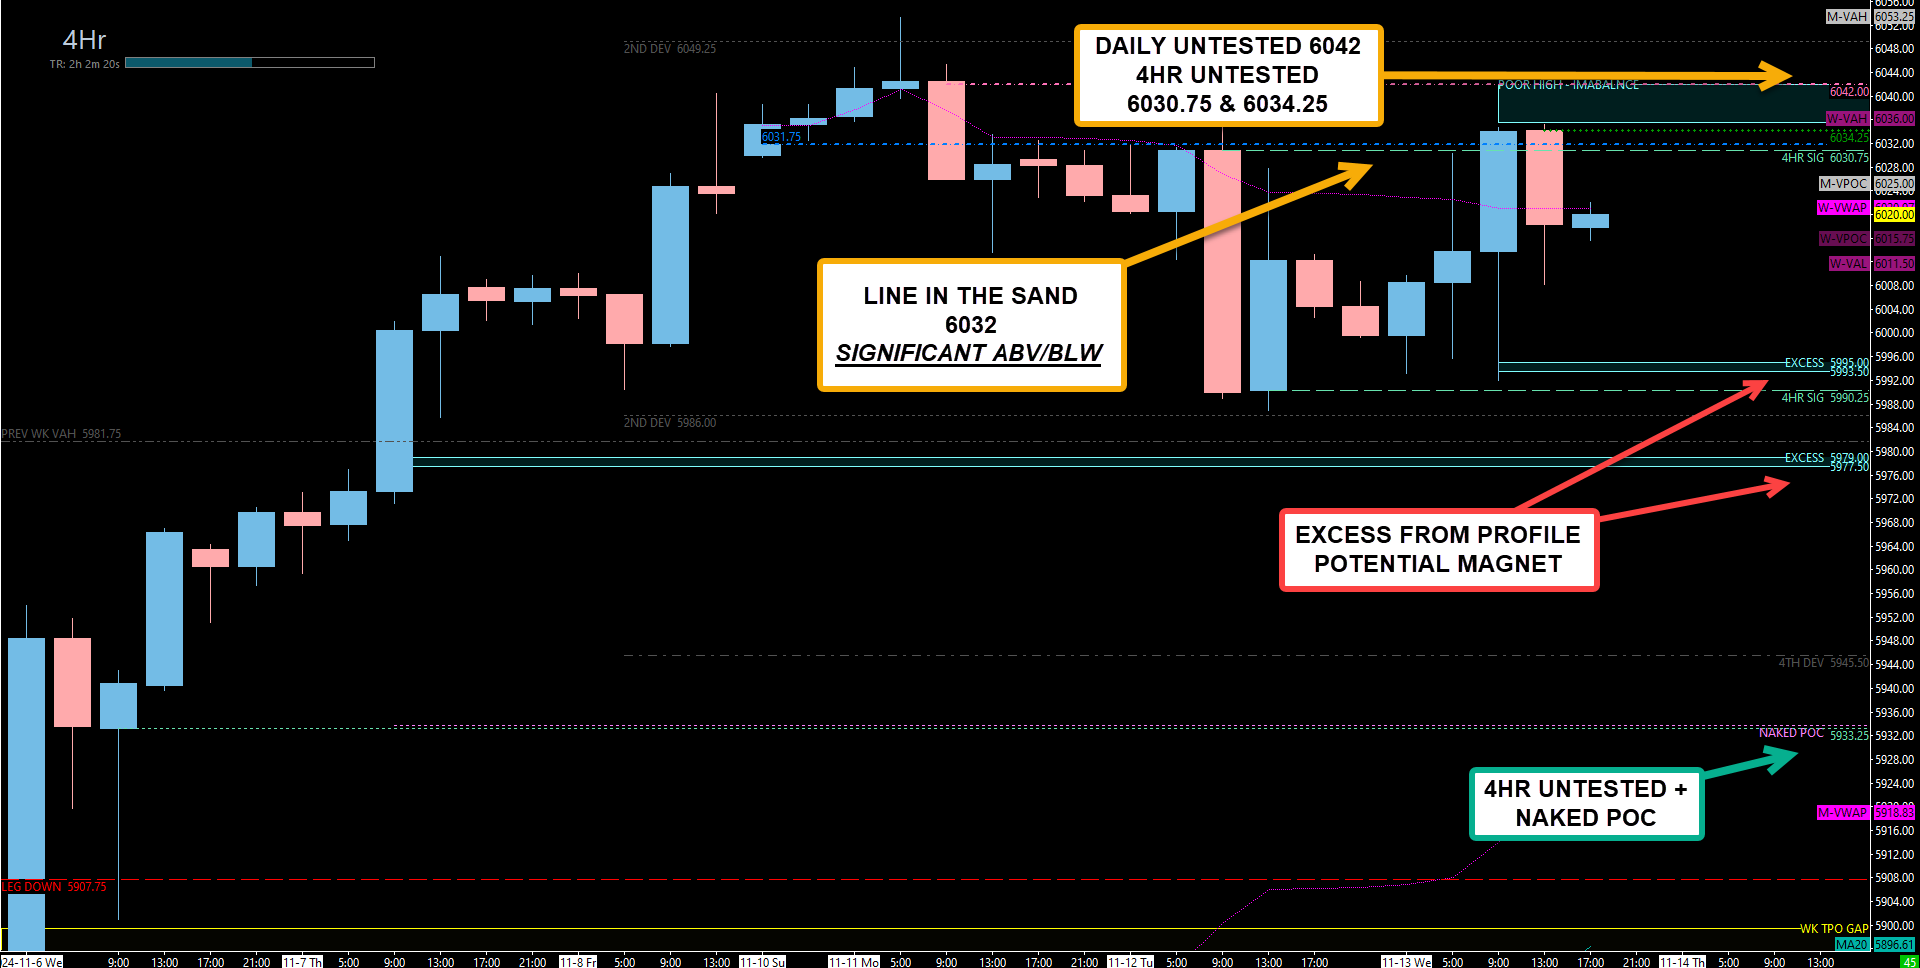
However, our plan held up. The untested 4-hour level at 6030.75—our Line in the Sand—played a crucial role, marking resistance that was tested at the news release and bringing price back down to the 4-hour support at 5990.25, which held perfectly and led to a bounce back up to our resistance at 6032 which ONCE AGAIN provided major resistance.
(Excerpt from YDays Plan)

Despite a day of range bound consolidation, we couldn’t be happier with how well these levels performed. Tomorrow, with PPI and additional red-tag news on deck including Powell on the Mic at 3pm EST, volatility will be high. Let’s stay prepared with a clear focus on the levels and trade plan below to capture the right opportunities.
Ryan Bailey
Vici Trading Solutions
NEWS

OPTIONS VOL
LEVELS
(RED HIGHLITED AREA ARE LEVELS OF SIGNIFANCE TO SEE PRICE BE ABOVE OR BELOW)

CHEAT SHEETS
WK/DAY TPO
WK/DAY
4HR
Trade Plan
Thursday Outlook
With the market moving in a tight, 5-day balance area, selecting a confident direction is challenging. However, 6032 remains our Line in the Sand for this area, and it’s crucial to monitor whether we hold above or below this level, as staying below 6032 could signal further weakness. Above 6032, we have an untested daily level at 6042 that aligns with a poor high from today’s profile. Given tomorrow’s red-tag news, this level may see some action, but caution is advised with short positions if price moves above our significant resistance at 6032.
A low-time-frame 1hr resistance exists at 6051, where trapped institutional traders may react, but be cautious of shorting above 6032 or 6042. Holding below 6032 maintains a bearish bias.
Key Levels to Watch
Resistance Levels
6051 (1-Hour Resistance): This untested level contains institutional traders caught at recent highs as well as our options volatility level, and a revisit may trigger resistance.
6042 (Daily Resistance): A critical high-time-frame resistance from today’s profile. A strong move above this level could push price up toward 6051 and potentially set new highs.
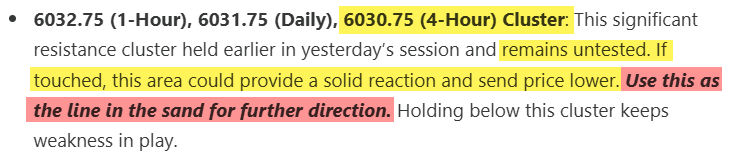
6034.25 (4-Hour), 6031.75 (Daily), 6030.75 (4-Hour) Cluster: This area remains untested from prior sessions and is expected to be significant on first touch. Holding below this cluster suggests sustained market weakness, while a move above it could lead quickly to 6042.
Support Levels
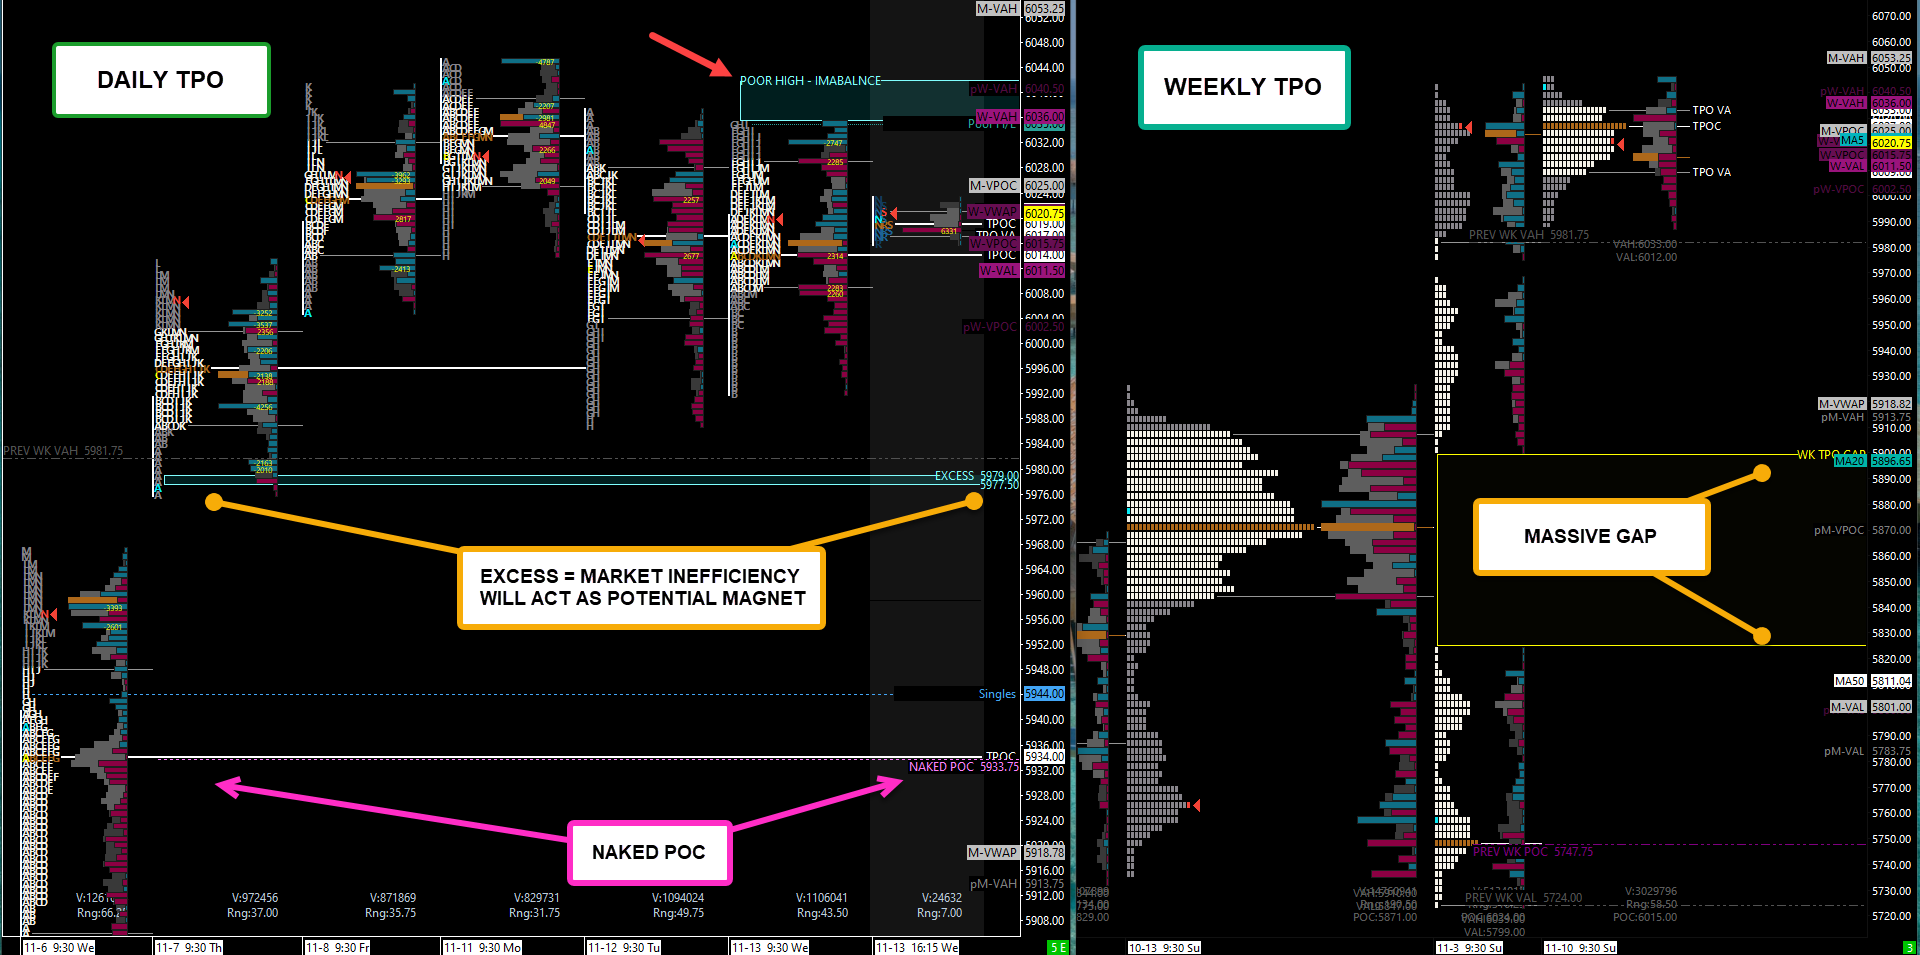
5993.50 (Market Profile Excess): Inefficiencies in this area may draw price for cleanup if the market trends lower.
5990.25 (4-Hour Support): Tested today and the last significant support level before 5933. If 5990 breaks, expect potential moves to 5978 or lower.
5978 (Market Profile Excess): Another area likely to attract price if 5990 breaks, setting the stage for a potential move to 5933.25.
5933.25 (4-Hour Support with Naked POC): The first major support below 5998.25 with strong confluence. If this level fails, we may see a test of 5907.75 (Significant Weekly Support).
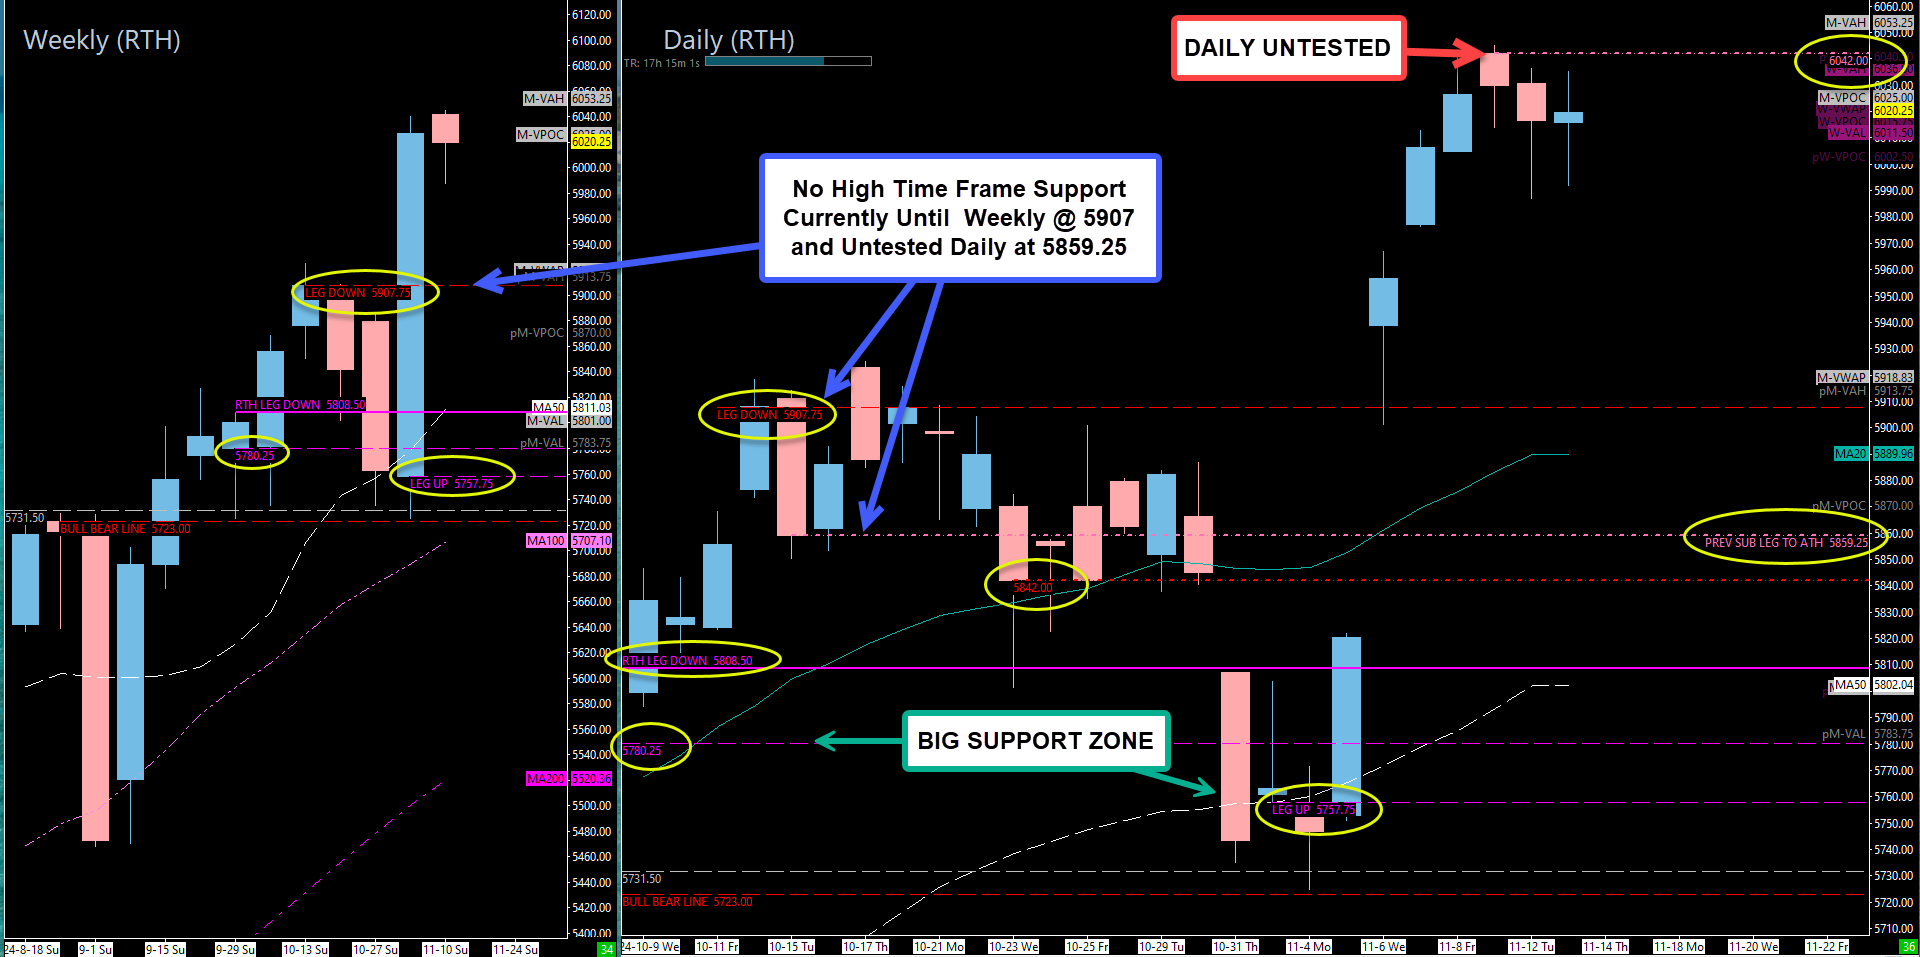
5907.75 (Weekly Line in the Sand): Previously generating a 130-point reaction on first touch, this level is crucial. A break here could swiftly lead toward 5859.25, with a broader gap between 5900 and 5827 potentially opening up.
Additional Lower Supports
5859.25 (Untested Daily Sub-leg): A previous sub-leg to the all-time high, still untested. This level is crucial for monitoring potential reactions.
5842 (Significant Daily Level): Previously critical in October as support, this tested level will serve as a key above/below guide.
5808.50 (Untested Monthly): This level was pivotal in prior months and remains untested from above, with potential to provide solid support.
5780.25 - 5757.75 (Weekly Support Zone): A 23-point zone from a prior weekly leg, ideal for long positions on a retest.
5731.50 (Weekly Support): Another key area, crucial for momentum and price positioning above or below.
5723 (Bull-Bear Line): The final support line for maintaining a bullish structure. Holding above 5723 keeps the structure intact, while a move below suggests a shift toward bearish dominance.
Key Takeaways
Critical Resistance Levels: Monitor 6032 as the Line in the Sand, with 6042 and 6051 above it.
Major Support Levels: Watch 5990, 5933.25, and 5907.75 closely for potential reactions.
Overall Bias: As long as we stay below 6032, weakness prevails. If 6032 breaks to the upside, we shift focus to the next key resistance levels.
Volatility Alert: Tomorrow’s PPI data will bring more volatility and Jerome Powell speaking at 3pm EST. Use caution, monitor key levels, and let price action confirm direction before committing to a position.
Stay sharp, trade safely, and together we’ll conquer these markets!
Ryan Bailey, VICI Trading Solutions