


S&P500 Trading Plan - ES Futures: CPI EDITION
10/10/2024

Hello Traders!
Once again, the bulls put on a showstopper today, pushing us back to surfing all-time highs! Last night, price dipped down and held the 5780 weekly level—our high timeframe line in the sand, which was given to you in advance at 5778.25. As the market opened, price quickly reclaimed our significant 5800 resistance level, setting the stage for a continuation to the upside. With the weekly touch at our backs, there was nothing stopping the S&P 500 from making new all-time highs as it continued its push higher throughout the day.
By midday, we had cleared our key daily level of 5823.75, which will be a critical level to monitor moving forward. This area will serve as our above/below marker as we head into tomorrow’s session, which brings the much-anticipated CPI report. Expect volatility, as CPI data is likely to be a major catalyst for market movement.
We’ve been in a three-week balance area, and today’s breakout signals a potential higher move if CPI confirms bullish sentiment. Currently, there are no significant bearish undertones in the market, and sentiment remains firmly in favor of the bulls. The S&P has established a significant amount of support underneath, providing us with numerous areas to consider buying dips. Let’s take a closer look at tomorrow’s trading plan and the key levels of interest.
News

Options VOL

Levels to Watch
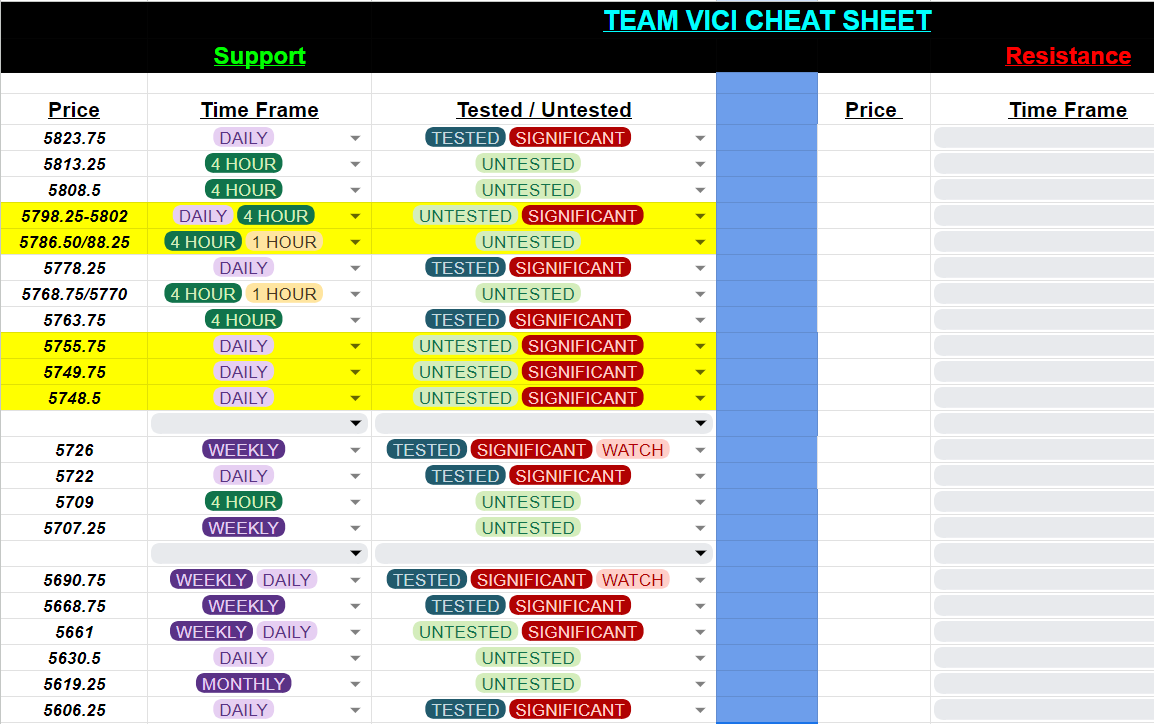
Cheat Sheets:
WEEKLY/DAILY TPO

WEEKLY DAILY

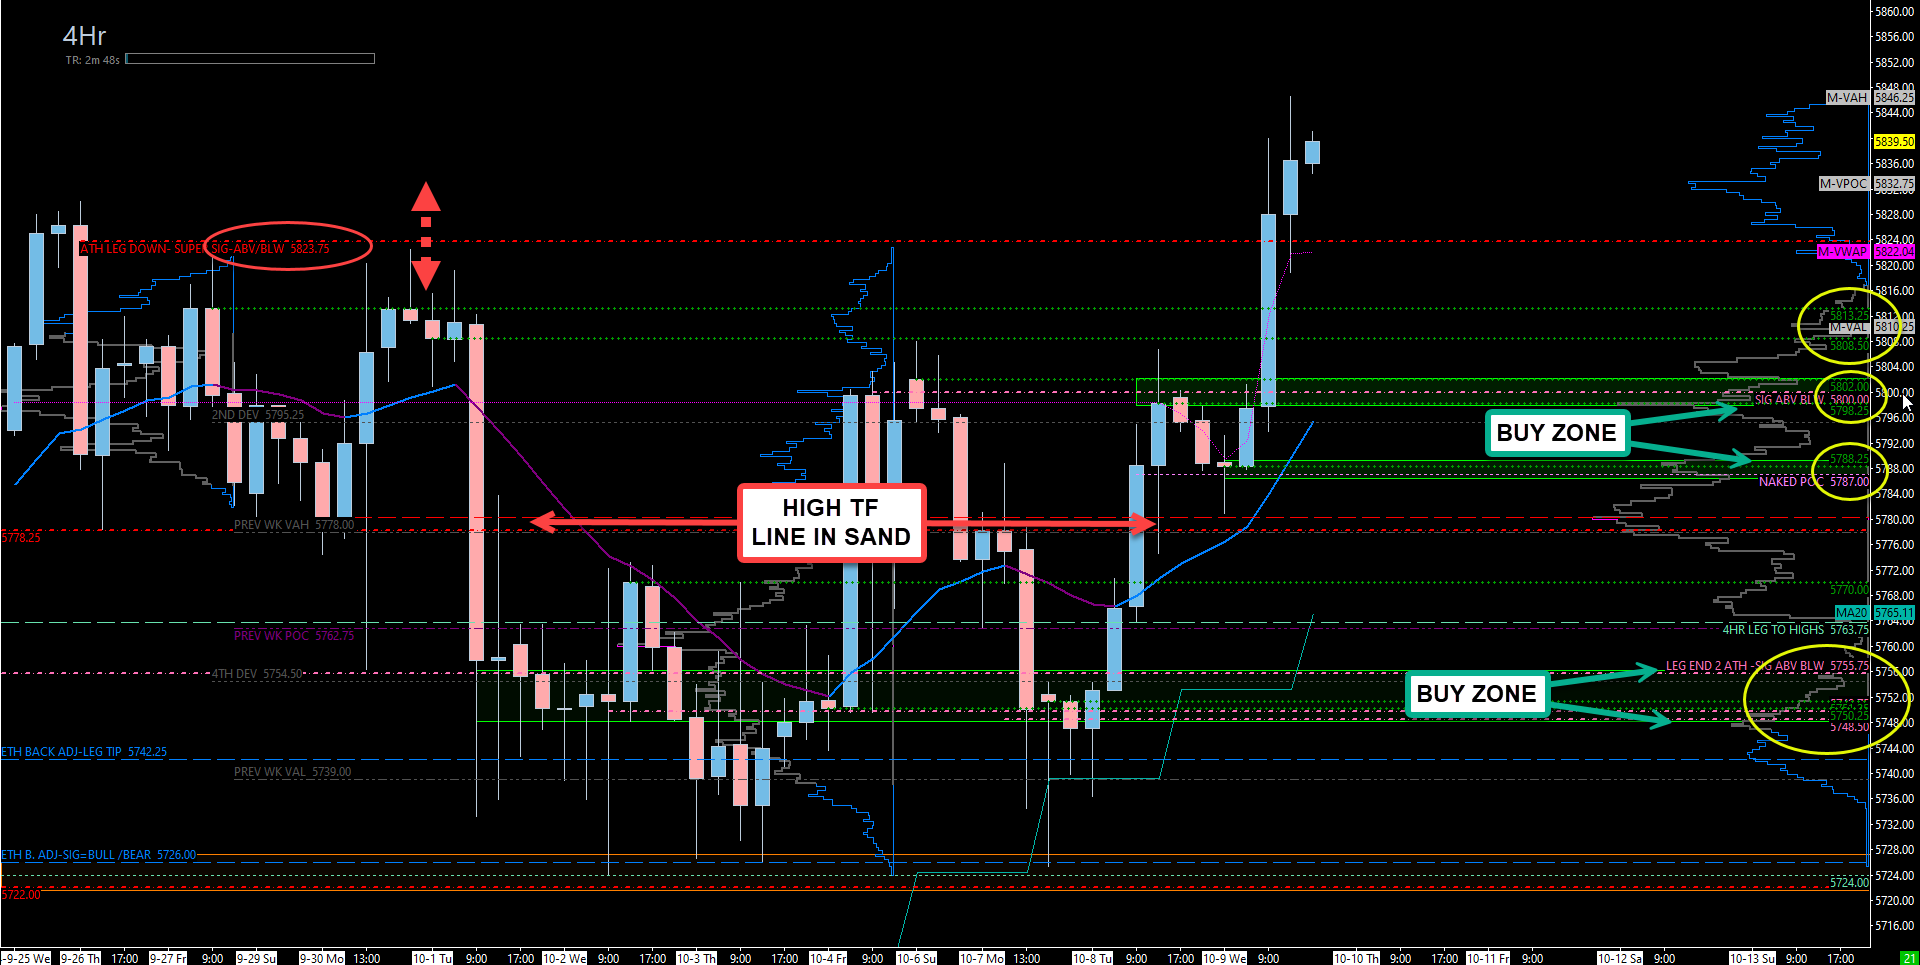
4HR
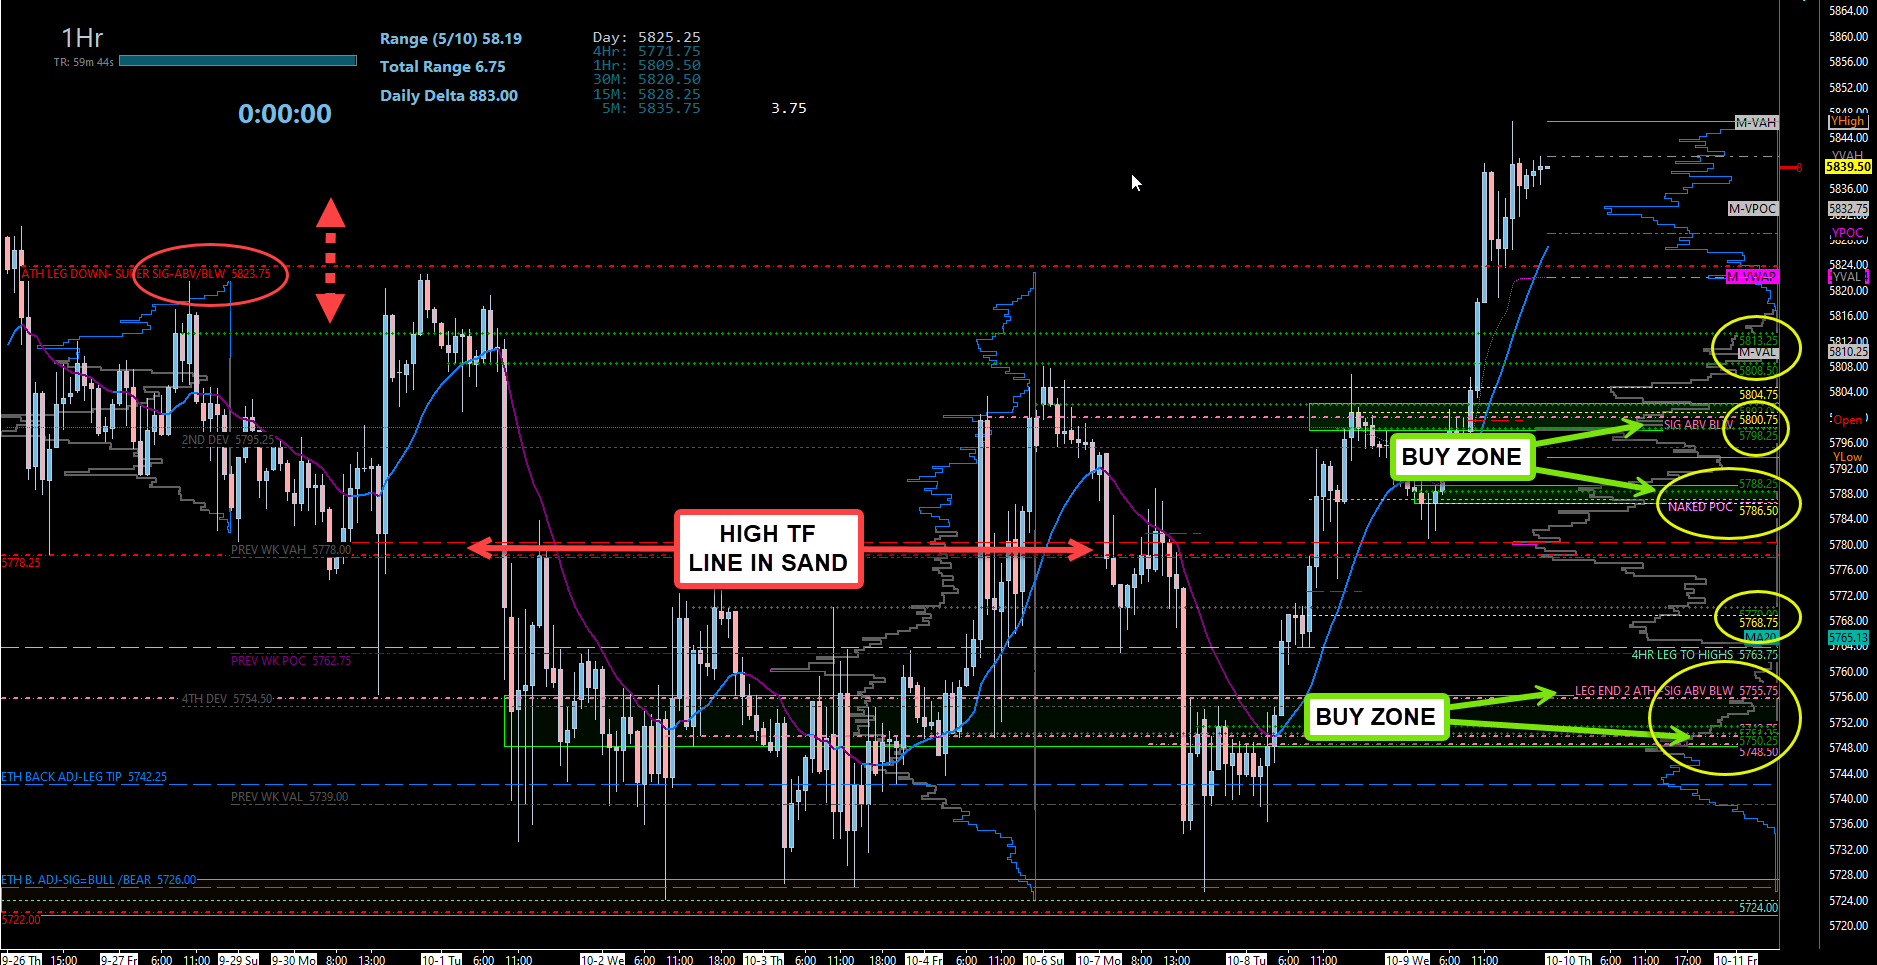
1HR
Trading Plan
Bullish Case:
Right now, bearish sentiment is non-existent in the market. We’re looking for areas of support to buy as support has been gained on all timeframes. Here’s what we’ll be watching:
5823.75 (Key Daily Level):
This is our above/below marker for tomorrow. Use this level as a guide for the bullish continuation or potential short-term pullbacks.5813.25 (4-Hour Level) & 5808.50 (4-Hour Level):
Both of these levels could provide a reaction, but I prefer 5808.50 due to its prior touches from the bottom up. If 5808.50 plays, we want to see an immediate regain of 5813.25 and a move back up to 5823.75 to confirm continued upside.5802-5798.25 (4-Hour Cluster):
There’s a small 1-hour level at 5804.75, but I’m looking for a slightly deeper pullback into the 5802-5798.25 (4-Hour Cluster) zone, which combines multiple daily and 4-hour levels, and includes yesterday’s open. This is a prime location for a long entry on the first touch.5788.25 (4-Hour Level) & 5786.50 (1-Hour Level):
There’s high confluence in this area with a naked POC and current week’s POC also aligning. This is a key support cluster to watch for a potential failed breakdown. If 5788.25 plays, look for a reclaim of yesterday’s low at 5794 and a quick move back above 5800.5780 (High Timeframe Line in the Sand):
This level remains our high timeframe marker. As long as we hold above 5780, the bullish bias remains intact.5770 (4-Hour Level) & 5768.75 (1-Hour Level):
This untested area could provide a reaction. Stops should be placed below 5763.75, which has been a critical support level for the past two weeks.5755.75 (Daily Level) & 5750 (Support Cluster):
This marks the new daily leg up and should offer a solid reaction on the first touch. Stops for this zone should be placed below 5742.5742 (Key Stop Area):
If we lose this zone, it could trigger a larger breakdown and bring us back to the 5726 weekly level, which has been a major support for maintaining our bullish structure.
Bearish Case:
If 5748.50 doesn’t hold, things could start to get ugly fast. Here’s what to watch for:
5726 (Weekly Level):
This has been tested multiple times and has held strong so far. However, I wouldn’t expect it to hold again under heavy pressure.5722 (Daily Level):
The next immediate support after 5726. Losing 5722 could lead to a quick drop into the 5709-5705 zone.5709-5705 (4-Hour/Daily Combo):
This zone needs to see a quick reclaim of 5726 for bulls to regain control. If we fail to reclaim and drop below 5709, the move lower could accelerate.5690 (Weekly Leg Tip):
A sustained break below 5690 would suggest a momentum shift to the bears.5668.75 (Major Bull/Bear Line):
This is the bull/bear line for a sustained move higher or lower. Losing 5668.75 would fully shift momentum into the bears’ hands.5661 (Daily/Weekly Combo):
If price reaches this level, we need to see an immediate reclaim of 5668.75. Failure to reclaim would indicate a catastrophic breakdown for the bullish trend.
Final Thoughts:
With the CPI report tomorrow, expect increased volatility. We’re in a key area, and how the market reacts to the data will determine if the breakout continues or if a deeper pullback is needed. Use the levels outlined above to guide your decisions, stay disciplined, and always manage your risk.
Let’s stay sharp and conquer these markets together!
Ryan Bailey
Vici Trading Solutions