


S&P500 TRADING PLAN: ES FUTURES- RETAIL SALES EDITION
11/15/2024 - FRIDAY

Hello Traders,
Today was an eventful day with PPI news sparking volatility, just as we anticipated. We maintained our bearish stance, emphasizing that holding below 6031 would likely signal continued downside. True to plan, price opened and stalled at the RTH close from yesterday and moved steadily lower, drawn directly to our target levels of 5993 and 5978 market excess, as outlined yesterday. Both levels, marked by inefficiencies in the market profile, pulled price toward them throughout the day.

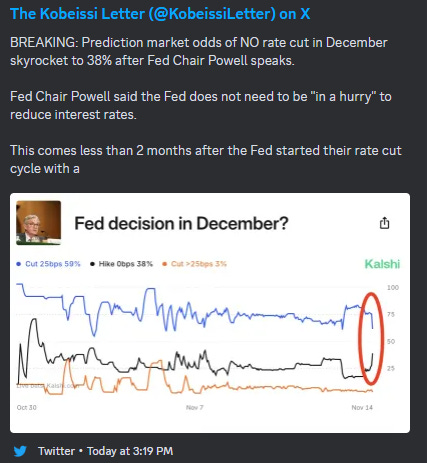
Further intensifying the market's mood, Fed Chair Jerome Powell indicated there’s "no rush" to cut interest rates, which the market may interpret as no rate cut in the next Fed meeting. Since recent rallies may have partly priced in rate cut optimism, this revelation could prompt a reversion, bringing asset prices back down to more balanced levels.
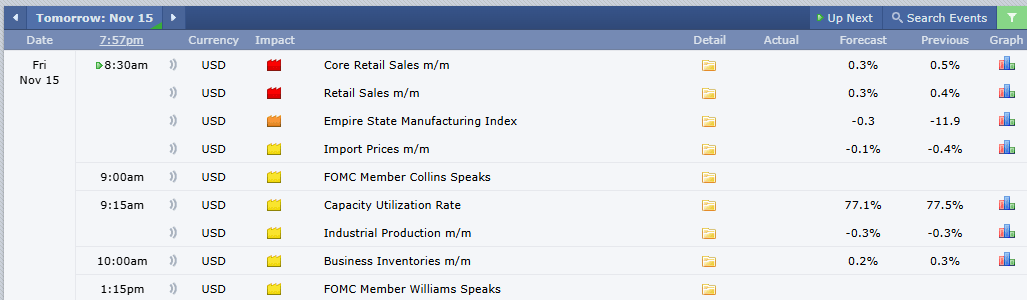
Tomorrow brings core retail sales pre-market, a major volatility driver that could fuel significant moves. With exuberance across asset classes after Trump’s election victory, any negative news could trigger swift downside. While we can’t predict the exact depth, we have clearly defined levels to guide us. Take a look below at the detailed trade plan to stay prepared. Stay focused, trade smart, and together, we’ll conquer these markets.
Ryan Bailey
Vici Trading Solutions
NEWS
OPTIONS VOL

LEVELS
CHEAT SHEETS
WKDAY TPO

WK/DAY
4HR


Trade Plan
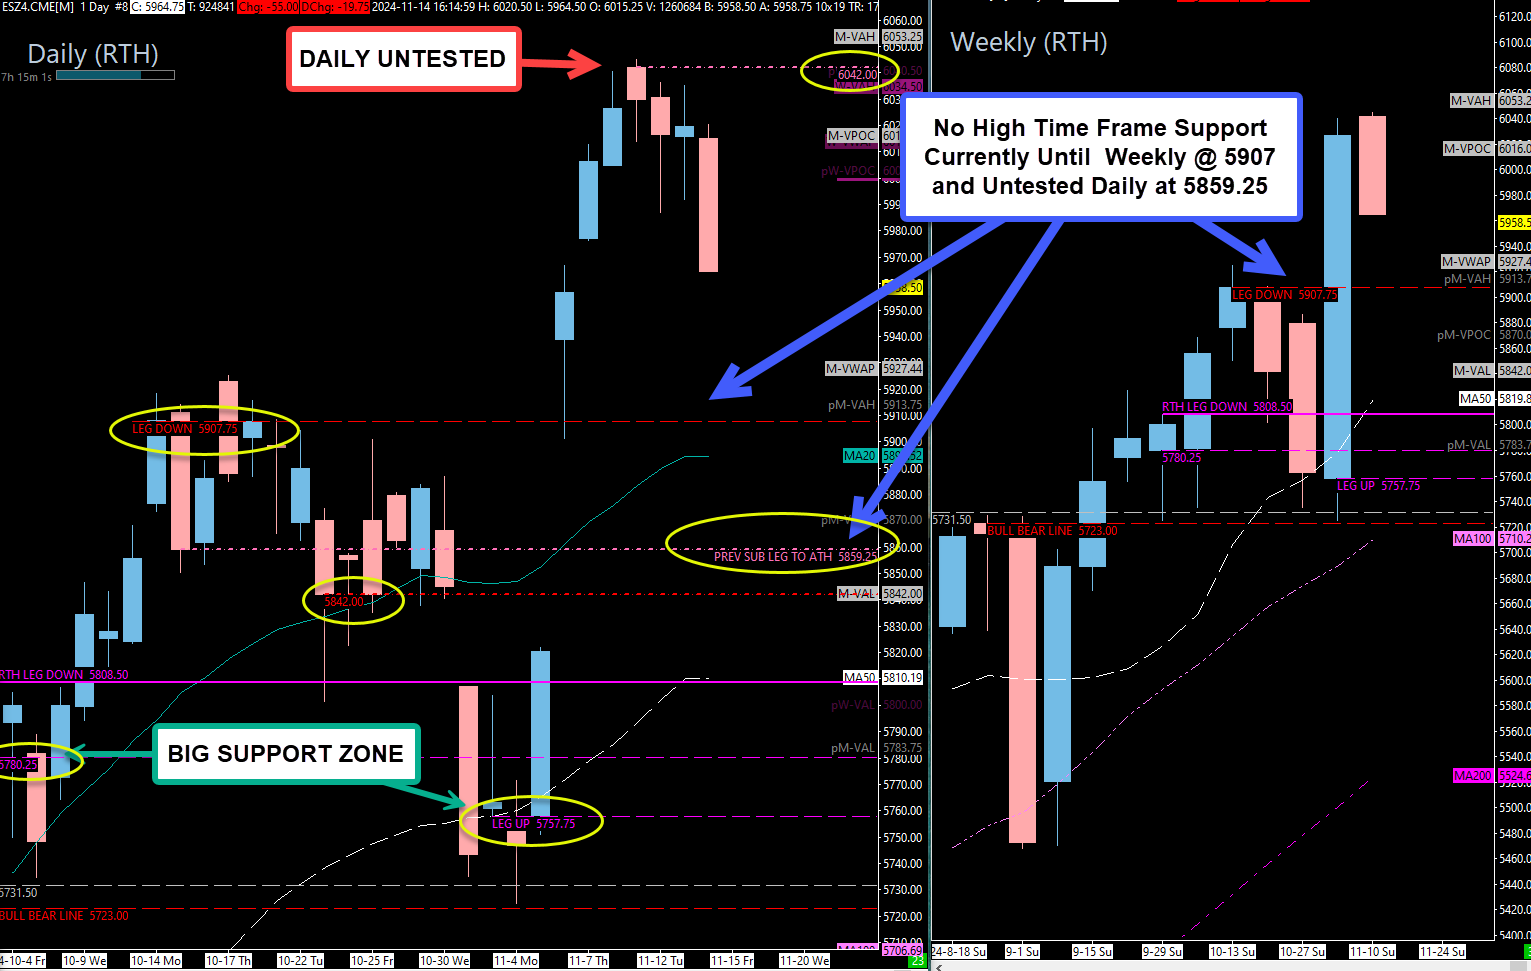
As highlighted, below 5990 we have little support until 5933.25, an untested 4-hour level and naked POC. While this level is likely to elicit a reaction, it may not be sufficient for a true rebound due to the momentum built from nearly a week of distribution. 5933.25 serves more as a target than a long entry, though it’s still an untested level with potential for a bounce.
Further above, 5990-5998.25 presents a hard resistance area, anchored by 5990.25 (untested), which also held yesterday’s POC. This resistance cluster could provide substantial reactions if price returns here, giving us a strong line for potential reversal setups.
As we continue lower, high-time-frame support is sparse until 5859 (untested daily). 5907.75 is a critical weekly level we expect bulls to defend heavily, as a break here would allow the market to explore filling the broad gap left from the pre election highs.
Key Levels to Watch
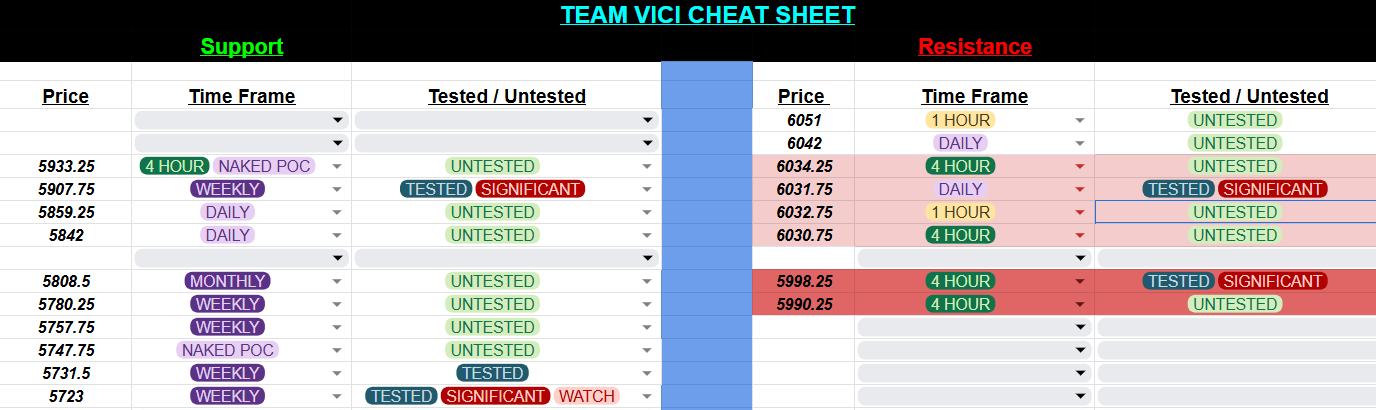
Primary Support Levels
5933.25 (4-Hour Support with Naked POC): This is the first significant support level below 5998.25, featuring strong confluence. If this level fails, the market may next test 5907.75 (Significant Weekly Support).
5907.75 (Weekly Line in the Sand): Generating a 130-point rally on first touch, this weekly support is essential for the market to hold. Below this level, price could rapidly move toward 5859.25, with an extended gap between 5900 and 5827 potentially opening up.
Additional Lower Supports
5859.25 (Untested Daily Sub-leg): This previous sub-leg to the all-time high remains untested. Monitor this level closely for potential reactions if approached.
5842 (Significant Daily Level): An important level throughout October, this daily support, though tested, will again serve as a key above/below guide for momentum shifts.
5808.50 (Untested Monthly): A previously pivotal level, untested from above, with potential for solid support if revisited.
5780.25 - 5757.75 (Weekly Support Zone): This 23-point zone, covering the previous weekly leg, serves as an ideal support for potential long positions on a retest.
5731.50 (Weekly Support): Another essential area, critical for maintaining momentum and for positioning above or below.
5723 (Bull-Bear Line): This is our final line in the sand to maintain a bullish structure. Holding above 5723 preserves bullish structure, while a move below indicates a shift toward bearish control.
Resistance Levels to Watch
Key Resistance Cluster
5990-5998.25: A robust resistance cluster that includes 5990.25 (untested from the previous session), as well as yesterday’s POC. This cluster will provide significant reactions and is our primary resistance until 6031.
6031 (Line in the Sand): This level remains our key bearish threshold. As long as price holds below 6031, we lean bearish.
Key Takeaways
Key Support Targets: Watch 5990.25, 5933.25, 5907.75, and 5859.25 for significant reactions.
Bearish Bias: Below 6031, the market remains in a bearish trend. If we lose 5907.75, the potential gap from 5900 to 5827 could attract price lower.
Risk Management: Let the pre-market news and early volatility from Core Retail Sales shake out before trading. Our plan remains to monitor key levels and look for high-probability reactions.
Stay focused, follow the plan, and together, let’s conquer these markets!
Ryan Bailey, VICI Trading Solutions