


S&P500 TRADING PLAN: ES FUTURES
11/12/2024- Tuesday

Hello Traders,
The “Trump pump” has been truly incredible! Following Trump’s winning nomination, markets have been soaring, with risk assets seeing substantial gains. The question now is whether we’re ready for a breather. While we haven’t lost any support yet, we’re starting to see signs of slowing momentum. With today being Veterans Day and the bond market closed, price action was relatively slow. However, if you were in the Substack chat today, you saw us short from 6042—yesterday’s open—all the way down to 6015, where we’re still expecting a bit more downside. Tomorrow holds no major news events, but several Fed speakers in the early afternoon could still bring market movement. Take a look at the trade plan below to see key levels I’m watching for both long and short setups. These are highly volatile times, so stay safe, patient, and focused—together, we’ll conquer these markets!
Ryan Bailey
Vici Trading Solutions
NEWS

OPTIONS VOL

LEVELS
CHEAT SHEETS
WK/DAY TPO


WK/DAY

4HR
Trade Plan
As of now, we remain bullish on all time frames. We haven’t lost support at any critical levels, so the trend remains firmly upward. Technically, we should focus on long positions as there’s been no clear reason to initiate substantial shorts—although two overhead levels may offer short scalping opportunities as we watch for a potential market pullback to address inefficiencies below.
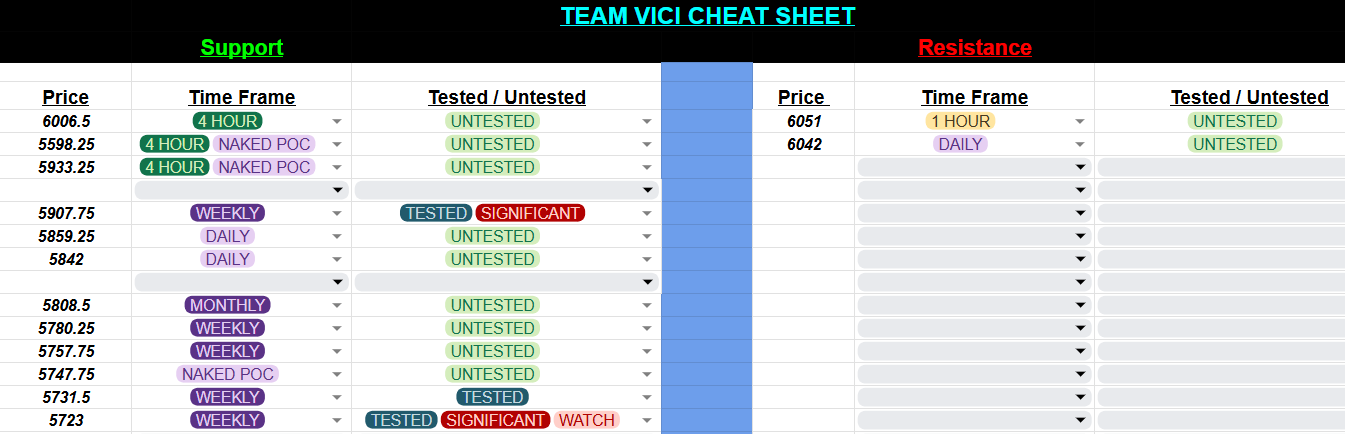
6051 (1-Hour Resistance): This untested level has several trapped institutional traders, caught buying near the highs. If we revisit this area, expect some reaction.
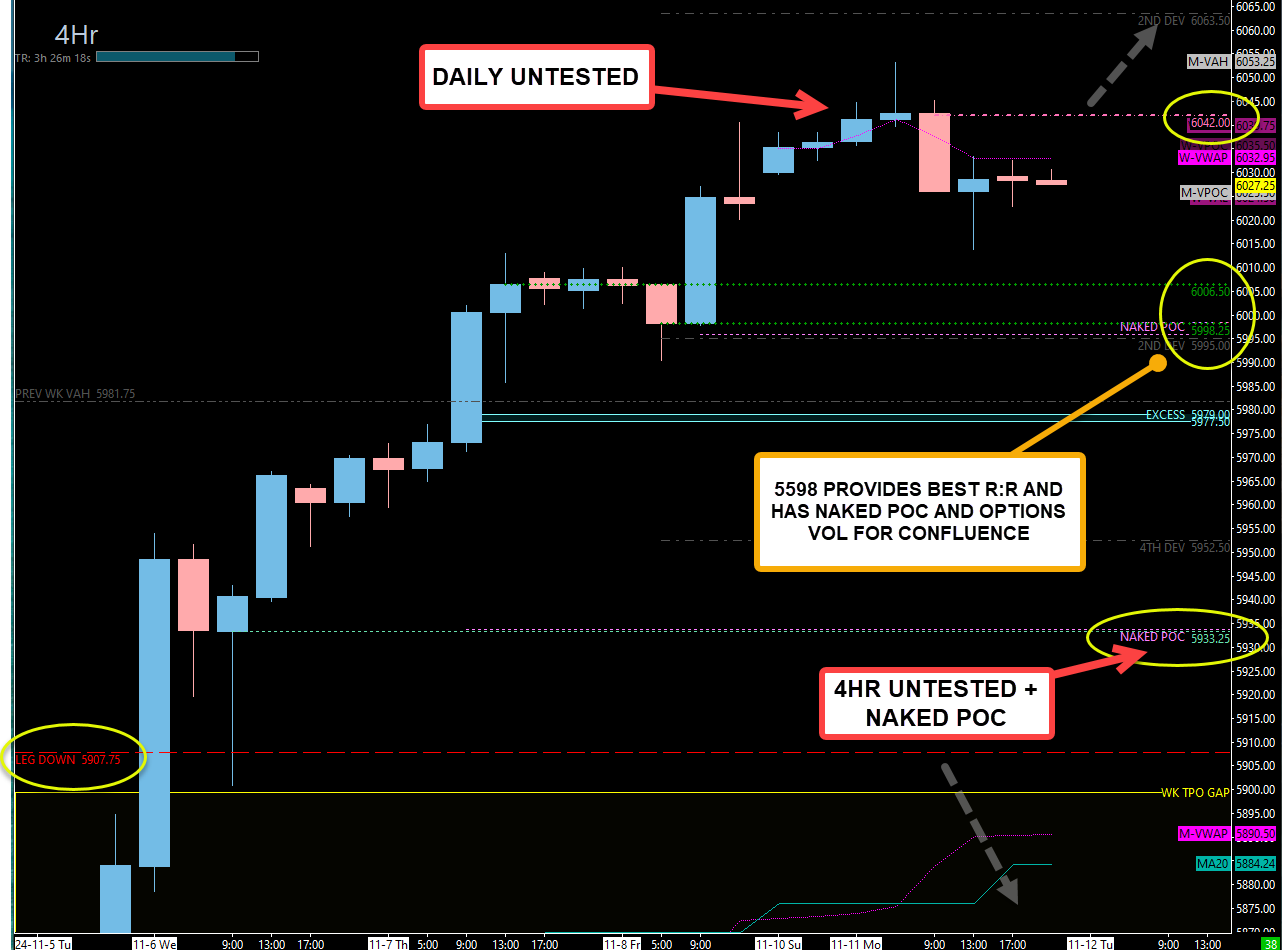
6042 (Daily Level): Today’s daily leg down, untested, may push price into 6006.50 (4-Hour Support) or the more intriguing 5998.25 (4-Hour Leg End), both untested. The 5998.25 level holds additional confluence with a naked POC and the second options volatility level, making it a strong potential support zone. A fail to hold this level could push us swiftly into our 4hr support at 5933.25.
5933.25 (4-Hour Support): This attractive support, our first major support after crossing 5907.75 (Weekly), also has a naked POC, adding strong confluence for another reaction level if price dips below 5998.25.
5907.75 (Significant Weekly Support): Tested previously with a 130-point reaction, this level is crucial as a support marker. A move below it could start filling the weekly gap between 5900 and 5827, with 5859.25 (untested Daily) in the center, potentially acting as a half-gap support.
5808.50 (Untested Monthly): Formerly critical for October and early November, this monthly level could provide solid support if tested from above.
5780.25 & 5757.75 (Weekly Support Zone): Running from 5780.25 (prior weekly leg up) to 5757.75 (new weekly leg), this 23-point zone provides a highly structured area for potential long reactions.
5731.50 (Weekly Support): Another essential level to monitor for positioning above or below.
5723 (Bull-Bear Line): Our final line in the sand for maintaining bullish structure. Holding above 5723 keeps the structure intact; losing this level would signal a shift toward bearish control.
Let’s make the most of the setups, trade smart, and stay vigilant for shifts as volatility rises.