


S&P500 TRADING PLAN: ES FUTURES

Hello Traders,
Today was another fantastic day as our plan played out perfectly! Yesterday, we rallied 70 points off our 5800 level right into the heavy resistance zone. As I mentioned in this morning’s email to subscribers, we were inside the critical 5869.25 resistance on ES, and I advised looking for potential weakness if price dropped below 5859. And that’s exactly what we got.

Once we broke below 5859, the market swiftly sold off 34 points, right into our significant daily support at 5823.75, which provided the base for a solid afternoon rally. Buyers, however, were still relatively weak, as price struggled to hold above our 5838.75 level. With tomorrow being another quiet day on the news front, volatility could still sneak in, leaving us wondering—was this dip the opportunity for buyers, or are sellers still in control?
Take a look at the trade plan below as we outline the exact levels we’re monitoring and how we plan to play them. Let’s finish the week strong together!
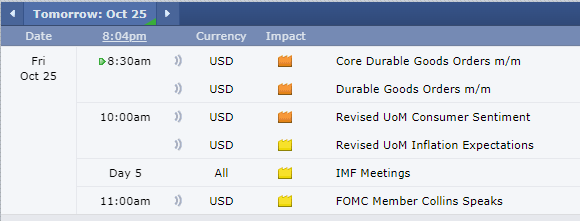
NEWS
OPTIONS VOL

LEVELS

CHEAT SHEETS
WK/DAY TPO

WK/DAY

4HR

Trade Plan
We are currently at an interesting point, with yesterday’s rally and today’s range playing right into our levels. As we closed below 5859.25—our key level for maintaining bullish structure—the door remains open for more downside unless buyers regain control.
Current Levels & Thought Process
5869.25 Daily Resistance: The market failed to close above this level, ending the day with a red doji. It remains a critical point to reclaim for any meaningful move up.
5859.25 Line in the Sand: This key daily marker is now resistance, and the market must clear it decisively for any bullish continuation.
5862.75 4-Hour Untested Resistance: This level, aligned with the weekly VWAP and yesterday’s value area high, could provide a quick reaction if tested. Failure to reclaim it keeps the downside bias intact.
The bigger picture: If price cannot move above 5869.25 and hold, we should expect a retest of the 5800 zone. Below 5853.50, the market will likely seek lower support to find new buyers.
Critical Support Zones to Watch
5838.75 (4-Hour) & 5837.25 (Daily):
A key zone where buyers stepped in today. Breaking below this area signals further weakness, targeting 5823.75 next.
5823.75 (Daily):
This pivotal level has been in play all week. Falling below will shift momentum toward bearish action, opening the path toward 5811, a significant 4-hour level from earlier sessions.
5802 - 5800 (4-Hour/Daily Combo):
The 5800 zone provided a strong bounce today, but any further weakness could see the market revisit this area. A failure to hold here risks a quick drop toward deeper levels.
5780.25 - 5778.25 (Daily Combo):
This zone remains the weekly leg up and serves as a key area to monitor for bullish or bearish shifts.
5755.75 - 5748.50 (Daily/Weekly Levels):
This untested zone marks the leg end to our recent rally and must hold for bulls to regain control. A strong reaction is expected on the first test; failure here will push the market toward the 5723 level.
Bearish Case
5723 (Weekly Level):
This key support has held multiple times but may not withstand another test. A break here could signal a deeper correction.
5709 - 5705 (4-Hour/Daily Combo):
Bulls must reclaim 5726 quickly if this zone is tested. Failure to do so could speed up the move lower.
5690 (Weekly Leg Tip):
A sustained break below this level confirms a shift toward bearish sentiment.
5668.75 (Major Bull/Bear Line):
Losing this key line shifts momentum fully into the bears' control.
Upside Levels to Monitor
5908 (Daily Level):
Reclaiming this level is essential for continued upside. Keep a close watch on these two untested levels above:
5918.75 (4-Hour)
5923 (Daily)
These levels could provide resistance on the first touch, but clearing them would pave the way toward resolving the bullish imbalance above.
Key Takeaways
Critical Support Levels: Keep a close eye on 5780, 5823.75, and 5853.50 to gauge shifts in momentum.
Buy Zone: The 5755.75 - 5748.50 zone is a high-probability support area. If it holds, expect another rally toward new all-time highs.
Bullish Bias: As long as 5853.50 holds, the bullish momentum remains intact. However, breaking below 5823.75 will shift momentum toward the downside.
Upside Targets: Watch 5918.75 (4-Hour) and 5923 (Daily) closely. A break above these levels will keep the bulls in control and push the market closer to resolving the bullish imbalance.
Conclusion
Stay sharp and disciplined as we navigate this range-bound market. Keep an eye on our key levels and be prepared for volatility to sneak in, even without news. Let’s stick to the plan and finish the week strong!
Until next time—trade smart, stay prepared, and together we will conquer these markets!
Ryan Bailey
Vici Trading Solutions