


S&P500 TRADING PLAN: ES FUTURES
10/23/2024 - Thursday

Hello Traders,
What a day! Not to toot our own horns, but... our plans have been flawless! Over the weekend, we warned of potential weakness creeping into the market, reiterated it again Monday morning via email, and followed up Tuesday—even after that temporary rally.
Our key level of 5908 proved to be the monster daily and weekly resistance we anticipated, and when it failed to hold on Tuesday, it set the stage for today’s powerful downside move. The break of 5867.50 accelerated the flush, and when 5853.50 gave out, things moved fast. But the real star of the day was the 5800/5802 Daily-4-Hour combo, which stopped the bleeding and launched us 50 points higher without any pullbacks! Those who stuck to the plan banked some serious profits—congratulations!
Looking ahead to tomorrow, we finally have red tag news to stir up more volatility:
Unemployment Claims (pre-market)
Flash Manufacturing PMI (after the open)
New Home Sales (10 a.m. ET)
This is shaping up to be a critical session, so check out the trade plan below to prepare and finish this week strong!
NEWS

OPTIONS VOL

LEVELS

CHEAT SHEETS
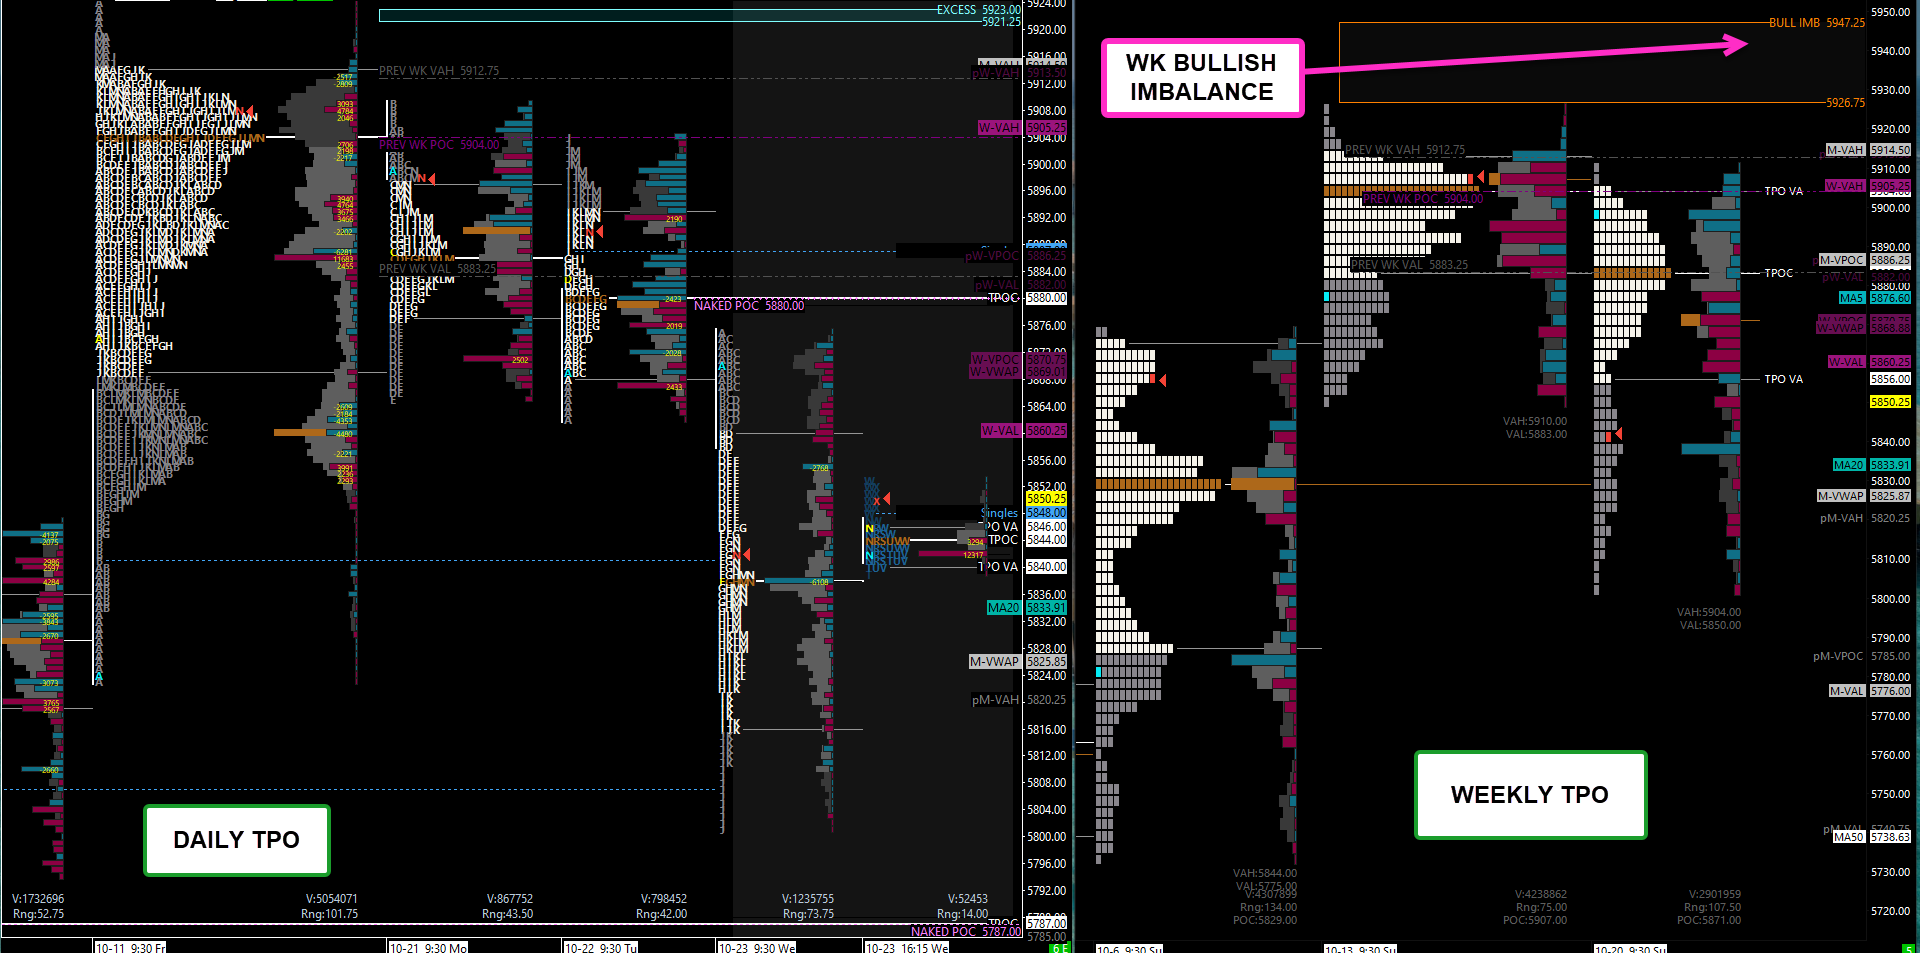
WK/DAY TPO
WK/DAY
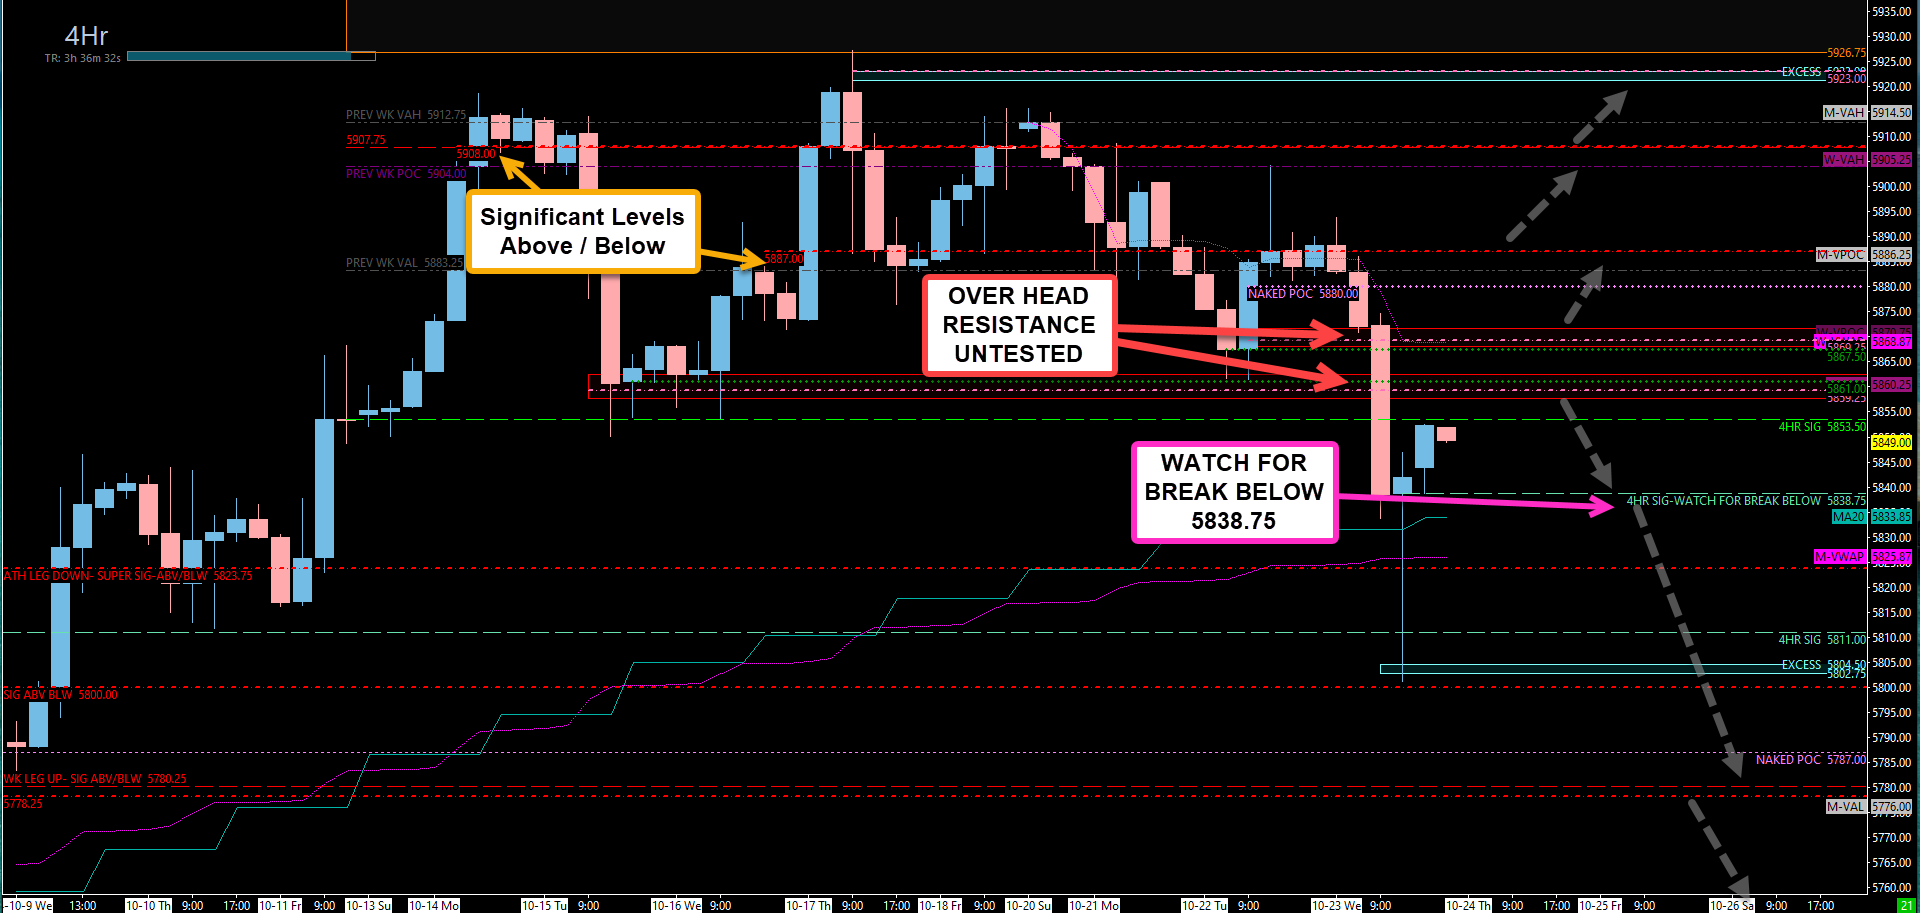
4HR
Trade Plan: Conquer The Markets
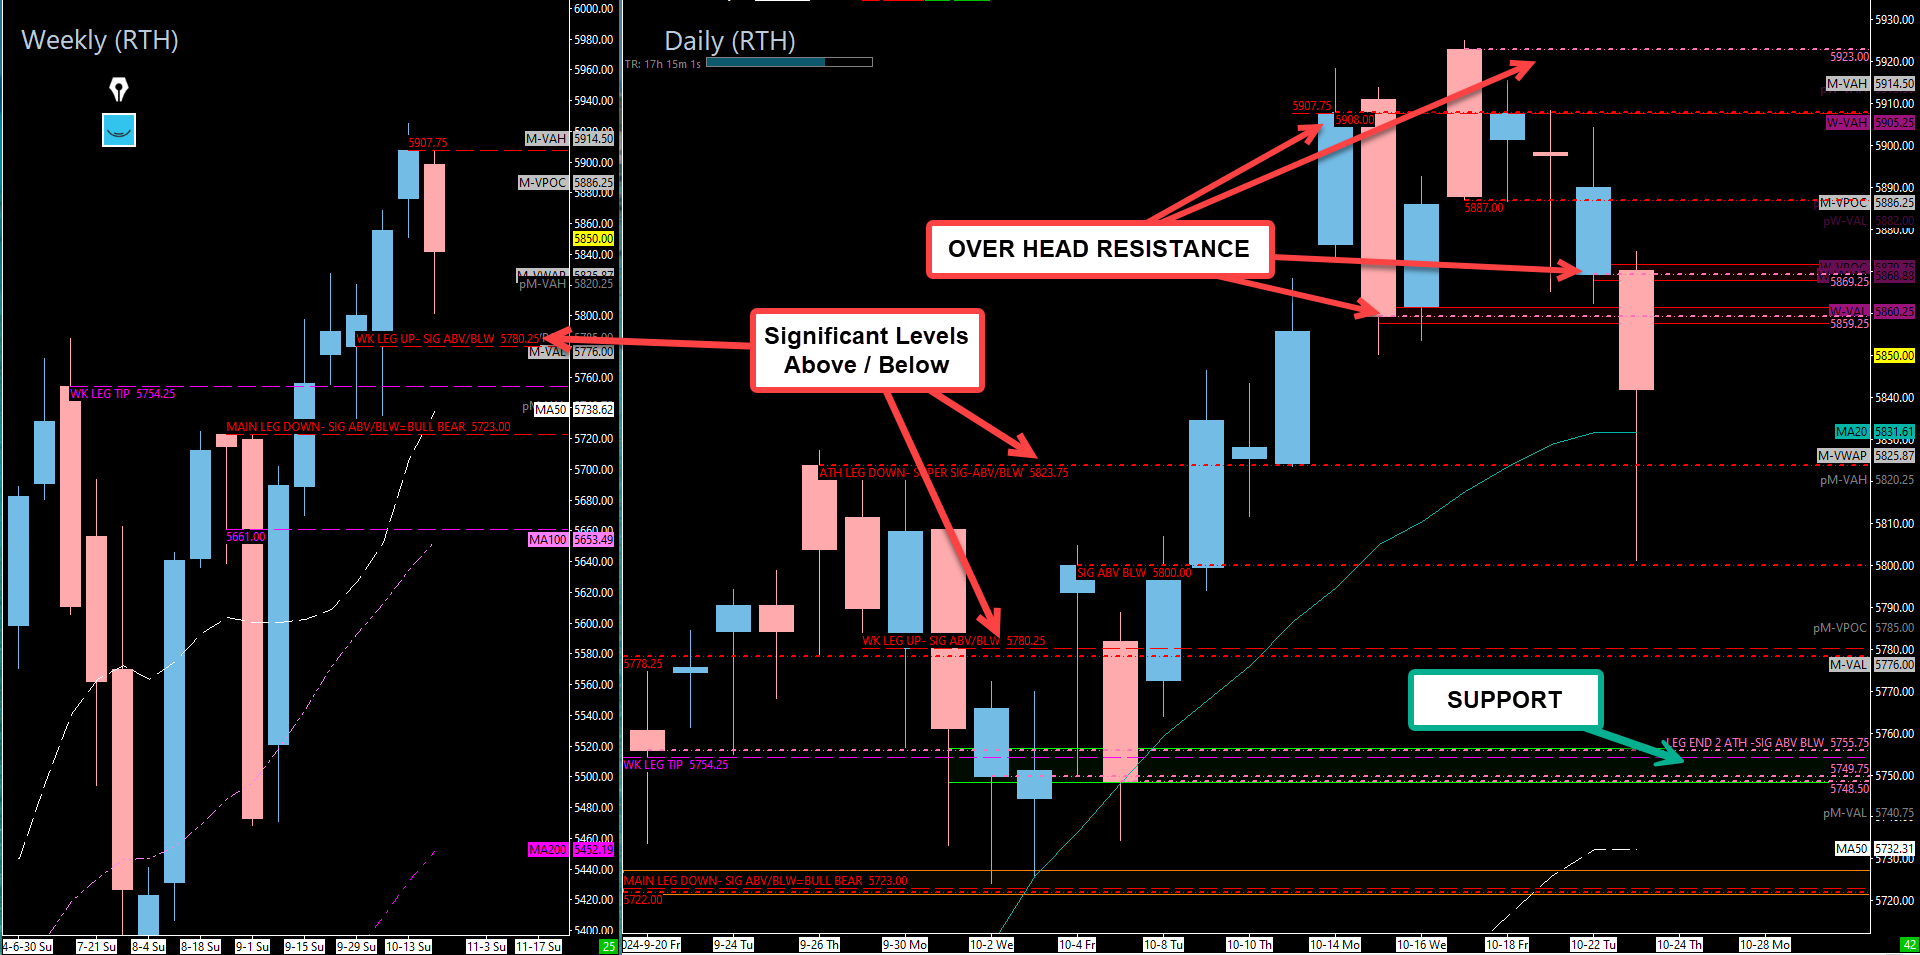
Today, we finally broke out of the massive 2-week range—and it was fast and sharp. This kind of explosive move happens after extended balance phases, and once balance breaks, price tends to move rapidly toward untested support or resistance. Now, the real challenge begins as we sit just below key levels that have been guiding the market all week.
5853.50 (4-Hour) & 5859 (Daily):
These were major support levels that the market failed to hold. Any further downside will depend on staying below these levels, which are now untested resistance. If price revisits these zones tomorrow, expect a reaction, but failure to reclaim them will suggest more downside is likely.5838.75 (4-Hour):
This level was formed during the evening session and has acted as a short-term support level. Breaking below this area would signal further weakness and open the door to test 5823.75 (Daily)—a critical level for structure and momentum shifts. This is also where yesterday’s POC sits, making it a key pivot point.5823.75 (Daily):
This level has been on our radar all week. A move below this level will indicate a momentum shift to the downside, with 5811 (another 4-hour level) as the next major guidepost. This zone was pivotal on October 9th and 10th, launching the market to all-time highs, so it’s worth monitoring closely.
Key Support Levels to Watch
5802 - 5800 (Daily/4-Hour Combo):
Tested today with a huge bounce, this level is critical. If the market dips again, this zone must hold, or we risk sliding into the next significant area of interest.5780.25 - 5778.25 (Daily Combo):
A highly-tested area that represents the weekly leg up. It’s a key above/below zone, signaling whether bulls or bears have the upper hand. Below this, the next significant area becomes the 5755.75 - 5748.50 zone.5755.75 - 5748.50 (Daily/Weekly Level):
This untested combination of two daily levels and a weekly is essential for maintaining bullish structure. If this zone holds, we could rally back toward new all-time highs. Failure to hold will send price toward 5723 (Weekly Level)—our bull/bear pivot point.
Bearish Case
5723 (Weekly Level):
If 5748.50 fails to hold, expect a swift move toward 5723, a level that has held multiple times. Under heavy selling pressure, however, it may finally break, which could trigger a deeper sell-off.5709 - 5705 (4-Hour/Daily Combo):
Bulls need to reclaim 5726 quickly if tested. Failing to do so could speed up the move lower.5690 (Weekly Leg Tip):
A sustained break below this level would confirm a shift toward bearish sentiment.5668.75 (Major Bull/Bear Line):
This is the critical dividing line between bullish continuation and bearish momentum. Losing this level will fully shift control to the bears.5661 (Daily/Weekly Combo):
If tested, bulls need to reclaim 5668.75 promptly to avoid further breakdowns.
Upside Levels to Monitor
5908 (Daily Level):
Reclaiming this level will be critical for any meaningful upside. However, keep an eye on the two untested levels above:5918.75 (4-Hour)
5923 (Daily)
These levels could trigger pullbacks if tested, but clearing them would progress the market toward resolving the bullish imbalance above.
Unrepaired Bullish Imbalance:
This remains a looming structure in the market. While we don’t know exactly when it will be resolved, it’s still a key part of our upside outlook.
Key Takeaways
Critical Support Levels: Monitor 5780, 5823.75, and 5853.50 closely to assess shifts in momentum.
Buy Zone: The 5755.75 - 5748.50 area is a high-probability support zone. If it holds, we could see another rally to new all-time highs.
Bullish Bias: As long as 5853.50 holds, the bullish momentum remains intact. A break below 5823.75 will shift momentum to the downside.
Upside Targets: Watch 5918.75 (4-Hour) and 5923 (Daily) closely. A sustained move above these levels will keep the bulls in control and push the market toward resolving the imbalance above.
Stay sharp, follow the plan, and let’s conquer these markets!
Ryan Bailey
Vici Trading Solutions