


S&P500 Trading Plan - ES Futures: PPI EDITION
10/10/2024 - Friday

Hello Traders,
Yesterday’s price action during the CPI release failed to bring much excitement, but our plan played out exactly as anticipated. We saw price dip into the 4-hour support at 5813.25, which provided a beautiful reaction, sending us back up 30 points before falling again, sweeping the lows, and rallying another 30 points.
Looking ahead, we have Core PPI data coming out in the morning, which is a red tag news event likely to cause some volatility. With the ES already surfing all-time highs, there’s potential for continuation in the direction of the trend, though expect some chop along the way. Take a look at the chart pictures and the significant levels I’ve highlighted below, as well as the trade plan which is still in effect as we continue to trend upward.
News

Options VOL
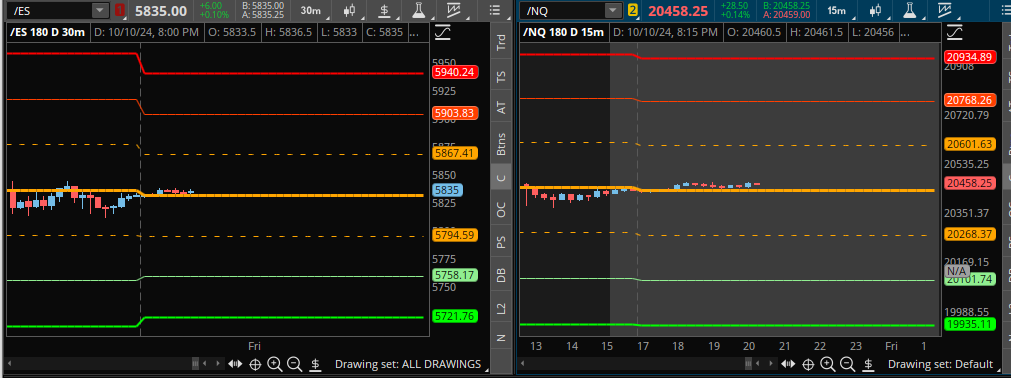
ES + NQ
Levels
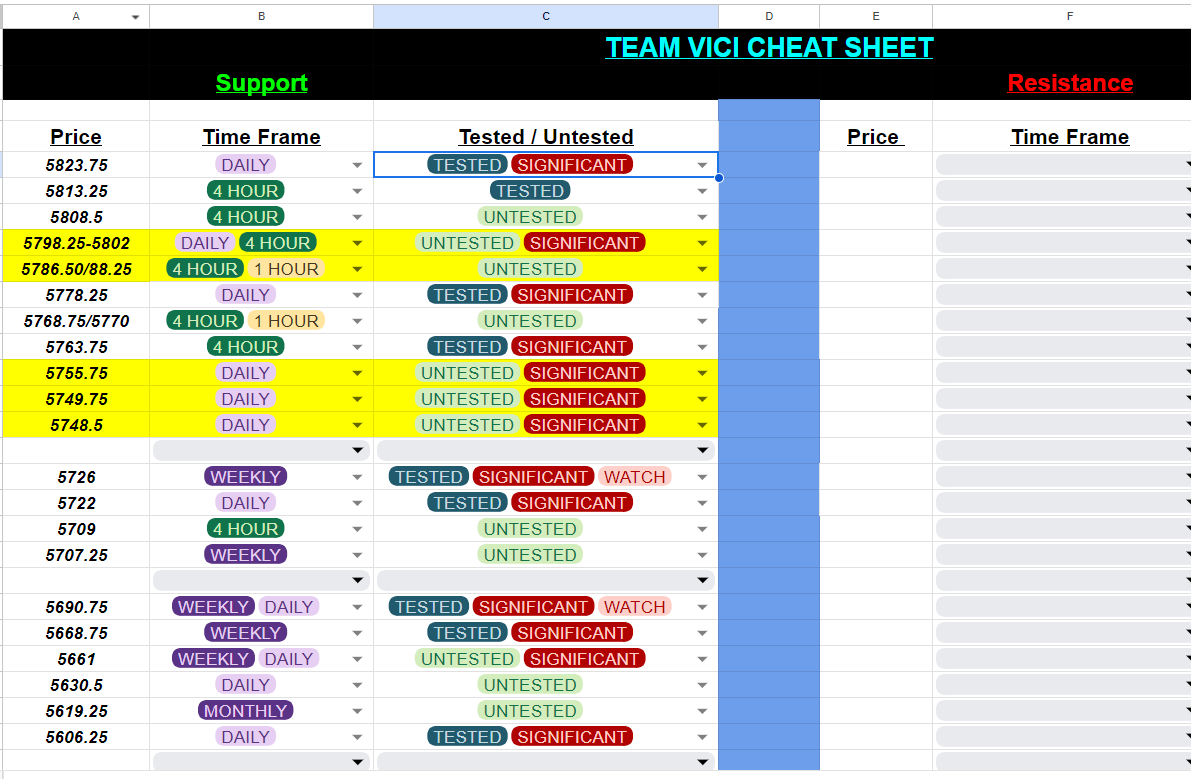
Cheat Sheets
TPOS

WK DAY

4HR

TRADE PLAN
The 4-hour support at 5813.25 has been tested multiple times and may be exhausted. If we push lower today, focus on the next 4-hour level at 5808.50, followed by our key daily level at 5800, which is expected to provide a solid reaction.
There’s a cluster of 4-hour levels between 5802 and 5798.25, with the daily at 5800 sitting right in the middle, making it an attractive zone to watch. This was the significant support that was lost and regained during our previous move up, and it should be monitored closely.
Below that, we have a support cluster around 5788.25 (4-hour), the naked POC at 5787, and the 1-hour level at 5786.50. This area is backed by high confluence and could provide a solid reaction if tested.
Key Levels to Watch:
5823.75 (Key Daily Level):
This is our above/below marker for the session. Use this level as a guide for bullish continuation or potential short-term pullbacks.5813.25 (4-Hour Level) & 5808.50 (4-Hour Level):
The 5813.25 level has been tested multiple times and may not hold again on another push lower. If 5808.50 plays, we want to see an immediate reclaim of 5813.25 and a move back up to 5823.75 to confirm continued upside.
5802-5798.25 (4-Hour Cluster):
This zone combines multiple 4-hour and daily levels and includes yesterday’s open. This is a prime location for a long entry on the first touch, given its strong context.5788.25 (4-Hour Level) & 5786.50 (1-Hour Level):
High confluence zone with a naked POC and current week’s POC also aligning here. If 5788.25 plays, look for a reclaim of yesterday’s low at 5794 and a quick move back above 5800.5780 (High Timeframe Line in the Sand):
This remains our high timeframe marker. As long as we hold above 5780, the bullish bias remains intact.5770 (4-Hour Level) & 5768.75 (1-Hour Level):
Untested area that could provide a reaction. Stops should be placed below 5763.75, a critical support level for the past two weeks.5755.75 (Daily Level) & 5750 (Support Cluster):
This marks the new daily leg up and should provide a solid reaction on the first touch. Stops for this zone should be placed below 5742.5742 (Key Stop Area):
If we lose this zone, it could trigger a larger breakdown, bringing us back to the 5726 weekly level, which has been a major support for maintaining our bullish structure.
Bearish Case:
If 5748.50 doesn’t hold, we could see a quick slide to our major weekly level at 5726. Here’s what to watch for on the downside:
5726 (Weekly Level):
This level has been tested multiple times and has held strong so far. However, I wouldn’t expect it to hold again under heavy pressure.5722 (Daily Level):
The next immediate support after 5726. Losing 5722 could lead to a quick drop into the 5709-5705 zone.5709-5705 (4-Hour/Daily Combo):
This zone needs to see a quick reclaim of 5726 for bulls to regain control. If we fail to reclaim and drop below 5709, the move lower could accelerate.5690 (Weekly Leg Tip):
A sustained break below 5690 would suggest a momentum shift to the bears.5668.75 (Major Bull/Bear Line):
This is the bull/bear line for a sustained move higher or lower. Losing 5668.75 would fully shift momentum into the bears’ hands.5661 (Daily/Weekly Combo):
If price reaches this level, we need to see an immediate reclaim of 5668.75. Failure to reclaim would indicate a catastrophic breakdown for the bullish trend.
Stay sharp, follow the plan, and let’s conquer these markets!
Ryan Bailey
Vici Trading Solutions