


S&P500 TRADING PLAN: ES FUTURES
Wednesday 10/30/2024

Hello traders!
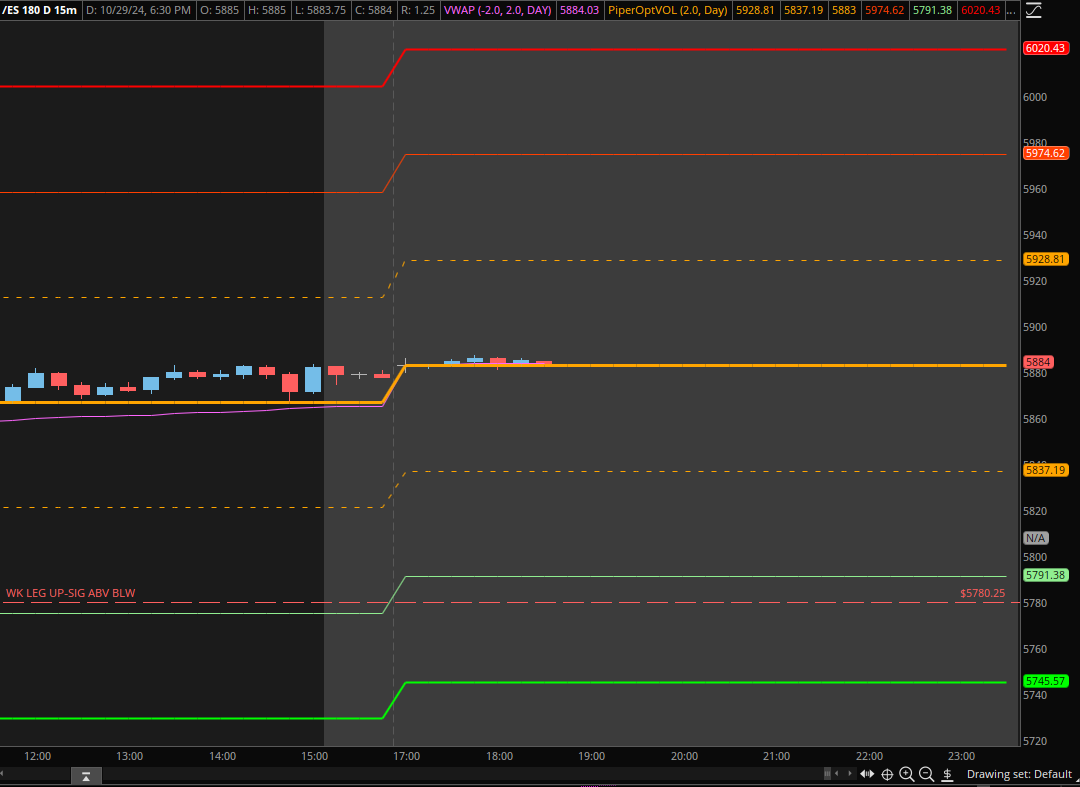
What a phenomenal day in the market! If you followed the plan, you absolutely crushed it once again. The 5870 resistance in Globex held perfectly, and when the market opened, the low of the day was 5837.75, exactly as we had highlighted in yesterday’s plan as the daily support. This level held firm, and we saw a powerful 43-point bounce.

Moving into tomorrow, we’ll be riding the wave of some major post-earnings action with tech stocks rallying. Additionally, we have some heavy-hitting red tag news like Non-Farm Payroll and Advanced GDP coming pre-market, so we can expect heightened volatility.
Check out the trade plan below to see exactly how we’re setting up for tomorrow. Let’s keep this momentum going and conquer the markets together!
Ryan Bailey
Vici Trading Solutions
NEWS

OPTIONS VOL
LEVELS
CHEAT SHEETS:
WK/DAY TPO

WK/DAY

4HR

Trade Plan:
Tomorrow is setting up to be an exciting day, riding the momentum of strong earnings and the heavy-hitting red tag news coming our way. We have a bullish imbalance on the daily profile stretching up to 5904, and I expect to see this area filled soon. However, my concern is as of this writing that we still haven’t gained ground on the 4-hour timeframe. This may happen in globex and would need a 4hr close above the 5881.50 level to confirm upside momentum. The NASDAQ has led the charge today rallying 300pts, and while the ES remains bullish, we must be cautious until we see confirmation of a sustained move above the key levels.
Today’s close above 5870 and, more importantly, 5859.25 gives us confidence in the bullish outlook, but we must be prepared for volatility. We’ve created a new daily leg up at 5852, which could serve as a strong buy zone tomorrow, especially with the added confluence of the 1-hour level at 5851.75. If we get a pullback into this area, it could provide an excellent buying opportunity, propelling the ES toward 5908 or even 5923.
I’ll continue to monitor the 5859.25 daily as a key above/below marker, and any dips below will focus on the 5842-5837.75 daily cluster. This cluster has held multiple times, but it may not hold on another test, and a failure here could lead us swiftly into the 5823.75 daily.
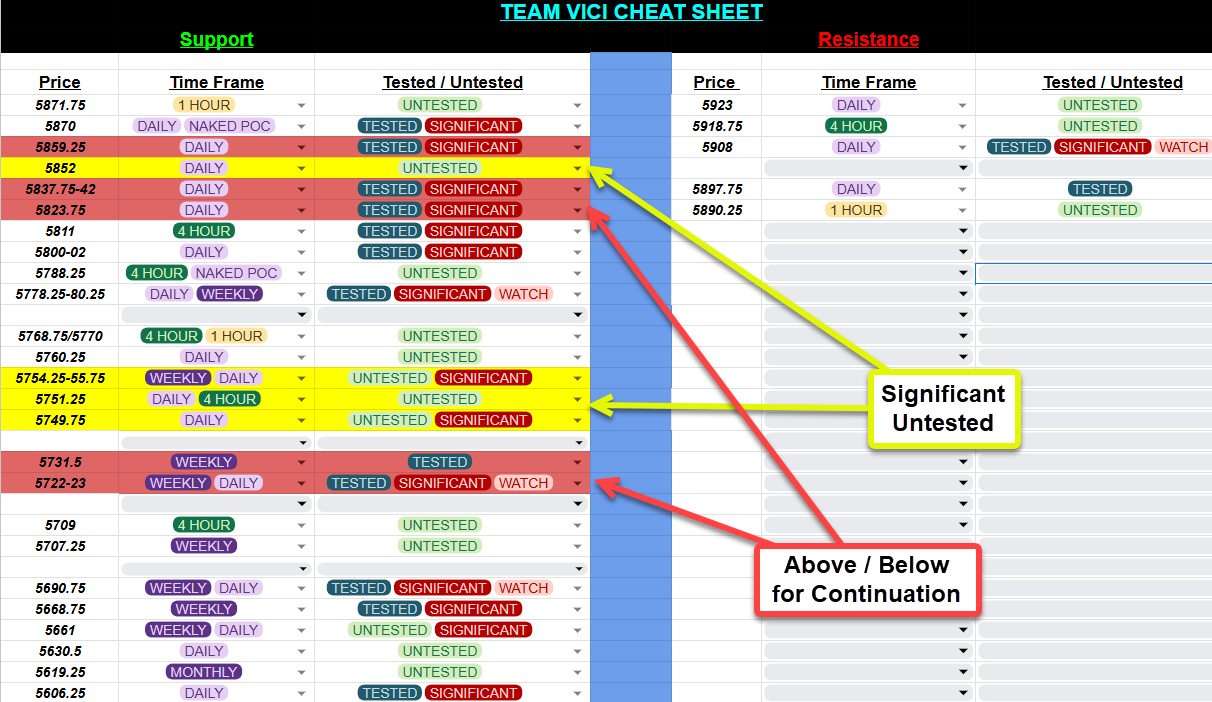
Critical Levels to Watch:
5870 (Daily Resistance):
This aligns with yesterday’s POC at 5869 and will be a key level for bulls to hold. If price fails to stay above this, expect a drop back toward 5859.25.5859.25 (Daily Leg End to ATHs):
This critical level has been pivotal for weeks. If price fails to hold above it, we could quickly slip into the 5852 untested daily support zone.5852 (New Daily Leg Up):
Created during Tuesday’s rally, this level is a major support zone, untested and highly important. There’s additional 1-hour confluence at 5851.75, making it a prime spot for a bounce.5842-5837.75 (Daily Cluster/4-Hour Support):
This area was the low of the day today and provided the reaction we expected. However, it has been tested multiple times and may not hold if retested. A break below here will likely trigger a move toward 5823.75.5823.75 (Daily Pivot):
This significant pivot will help gauge momentum. If lost, expect a move toward 5811 and the 5802-5800 daily/4-hour combo.
Lower Support Levels:
5802 - 5800 (Daily/4-Hour Combo):
This level offered a strong bounce last week, but further testing could break it. If it fails, we’ll likely see a continuation lower.5780.25 - 5778.25 (Weekly/Daily Line in the Sand):
This is a key high timeframe level that bulls must defend. If breached, expect a momentum shift and further downside.5755.75 - 5749.75 (Daily/Weekly Support Cluster):
A major untested buy zone, with confluence from both daily and weekly levels. This is a critical area for buyers to step in, and holding it could lead to a rally toward new all-time highs.5723 (Weekly Bull/Bear Line):
If the market slips below 5749.75, we could see a fast move toward 5723—a critical boundary between bullish continuation and bearish momentum. Below this level, the bears gain control.
Bearish Case:
5705.25 (4-Hour):
If 5723 fails, this will be the next downside target. Bulls must reclaim 5726 quickly, or we could see acceleration to the downside.5690 (Weekly Leg Tip):
A break below this level signals a shift toward bearish sentiment and could lead to further selling pressure.5666.00 (Major Bull/Bear Line):
The ultimate dividing line between bullish continuation and bearish momentum. Losing this level signals that the bears are in control.
Upside Levels to Monitor:
5908 (Daily Level):
Reclaiming and closing above this level will restore bullish momentum, setting the stage for a push higher.5918.75 (4-Hour) and 5923 (Daily Resistance):
These untested levels could trigger reactions if hit. Watch for potential pullbacks, but clearing these levels will move us closer to resolving the unrepaired bullish imbalance.
Key Takeaways:
Critical Support Levels:
Monitor 5780, 5823.75, and 5859.25 for signs of momentum shifts.Buy Zone:
5852 is the new daily leg up and could provide a solid reaction, potentially propelling the market past 5900. Below that, the 5755.75 - 5749.75 area is a high-probability support zone. If this level holds, we could see another rally toward new all-time highs.Bullish Bias:
As long as 5837.75 holds, the bullish momentum remains intact. However, a break below 5823.75 will shift momentum to the downside.Upside Targets:
Watch 5918.75 (4-Hour) and 5923 (Daily) closely. Clearing these levels will keep the bulls in control and move us closer to resolving the imbalance above.
Stay sharp, follow the plan, and let’s conquer these markets!
Ryan Bailey
Vici Trading Solutions
That’s a lot of good info