


S&P500 TRADING PLAN: ES FUTURES- CPI EDITION
11/13/2024 - WEDNESDAY

Hello Traders,
Today brought the weakness we were anticipating! In my pre-market email, I highlighted the significance of levels at 6029.5 and 6033, mentioning that staying below these could signal a downward move.

Sure enough, after touching yesterday’s point of control, we saw a steady sell-off. Price reached down to breach our 5998.25 level, swept the low, and then rebounded up to our 6026 4-hour level. Tomorrow’s CPI report is expected to bring significant volatility, especially with the market near all-time highs. This release could either propel us higher or finally clean up the inefficiencies below. Take a look at the detailed trade plan for the key levels we’re monitoring. Stay diligent, stay safe, and together we’ll conquer these markets!
Ryan Bailey
Vici Trading Solutions
NEWS

OPTIONS VOL

LEVELS
CHEAT SHEETS:
WK/DAY TPO

WK/DAY
4HR
Trade Plan
Today’s close confirmed some weakness in the market, losing our 4-hour support and ending around 5590, marking the first real signal of a potential shift. We rebounded briefly after sweeping the low near 90, reaching the 6026 level before selling off again into the close. With tomorrow’s CPI release, expect anything—but here’s how we’re prepared for both directions:
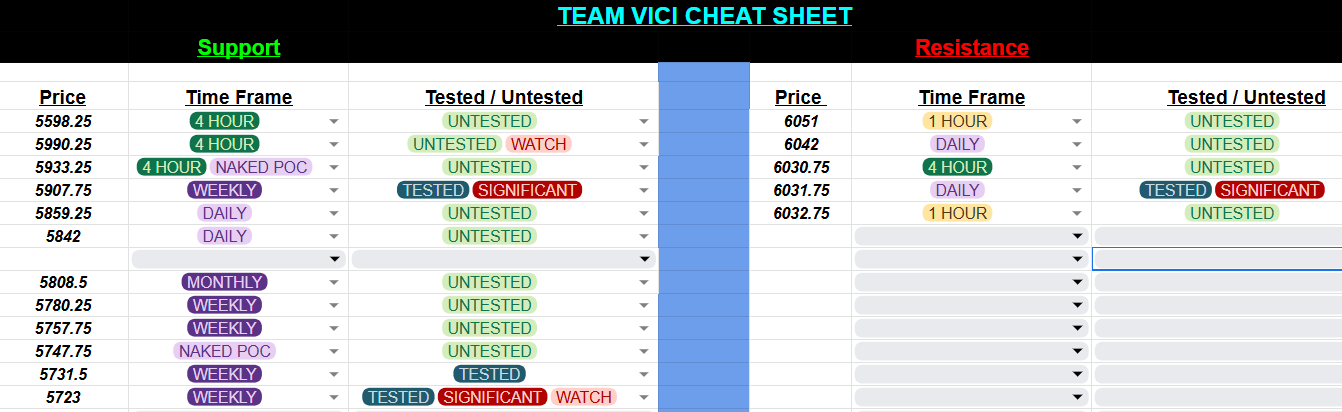
Key Levels to Watch
6051 (1-Hour Resistance): An untested level where institutional traders are caught at highs. Expect potential resistance on a revisit.
6042 (Daily Resistance): A high-time-frame resistance from today’s daily leg down. A sustained move above this could take us toward 6051 and potentially push to new all-time highs.
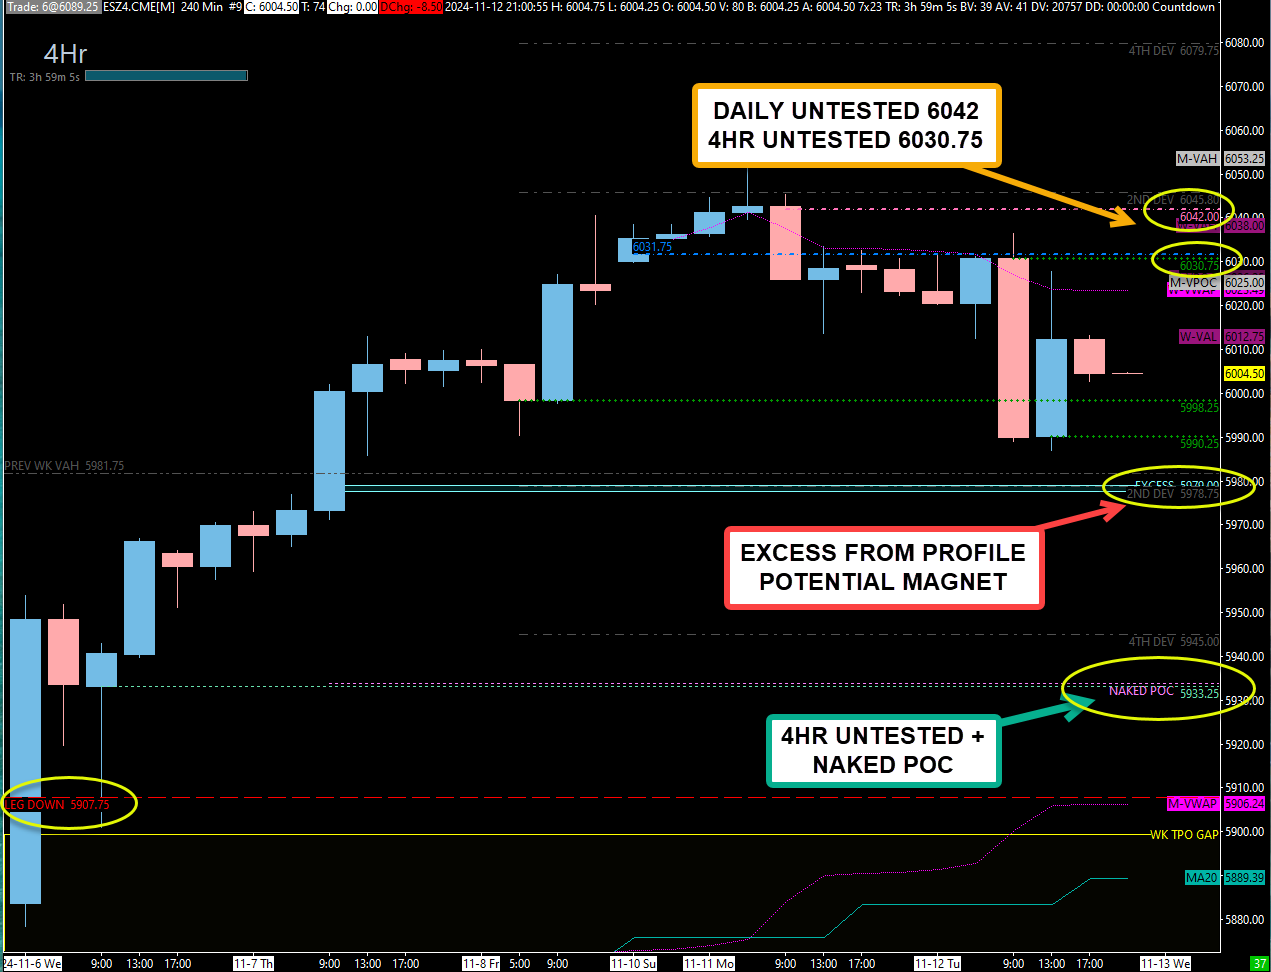
6032.75 (1-Hour), 6031.75 (Daily), 6030.75 (4-Hour) Cluster: This significant resistance cluster held earlier in yesterday’s session and remains untested. If touched, this area could provide a solid reaction and send price lower. Use this as the line in the sand for further direction. Holding below this cluster keeps weakness in play.
5998.25 & 5990.25 (4-Hour Levels): Created from the recent move to all-time highs, with 5990.25 added today. This is the only support zone we have between here and 5933. A break below 5990 could lead us to 5978, where an excess in the market profile remains and may act as a magnet.
5978 (Market Profile Excess): An area needing clean-up from inefficiencies, likely to attract price down if 5990 breaks. Below this, watch for a potential move to 5933.25.
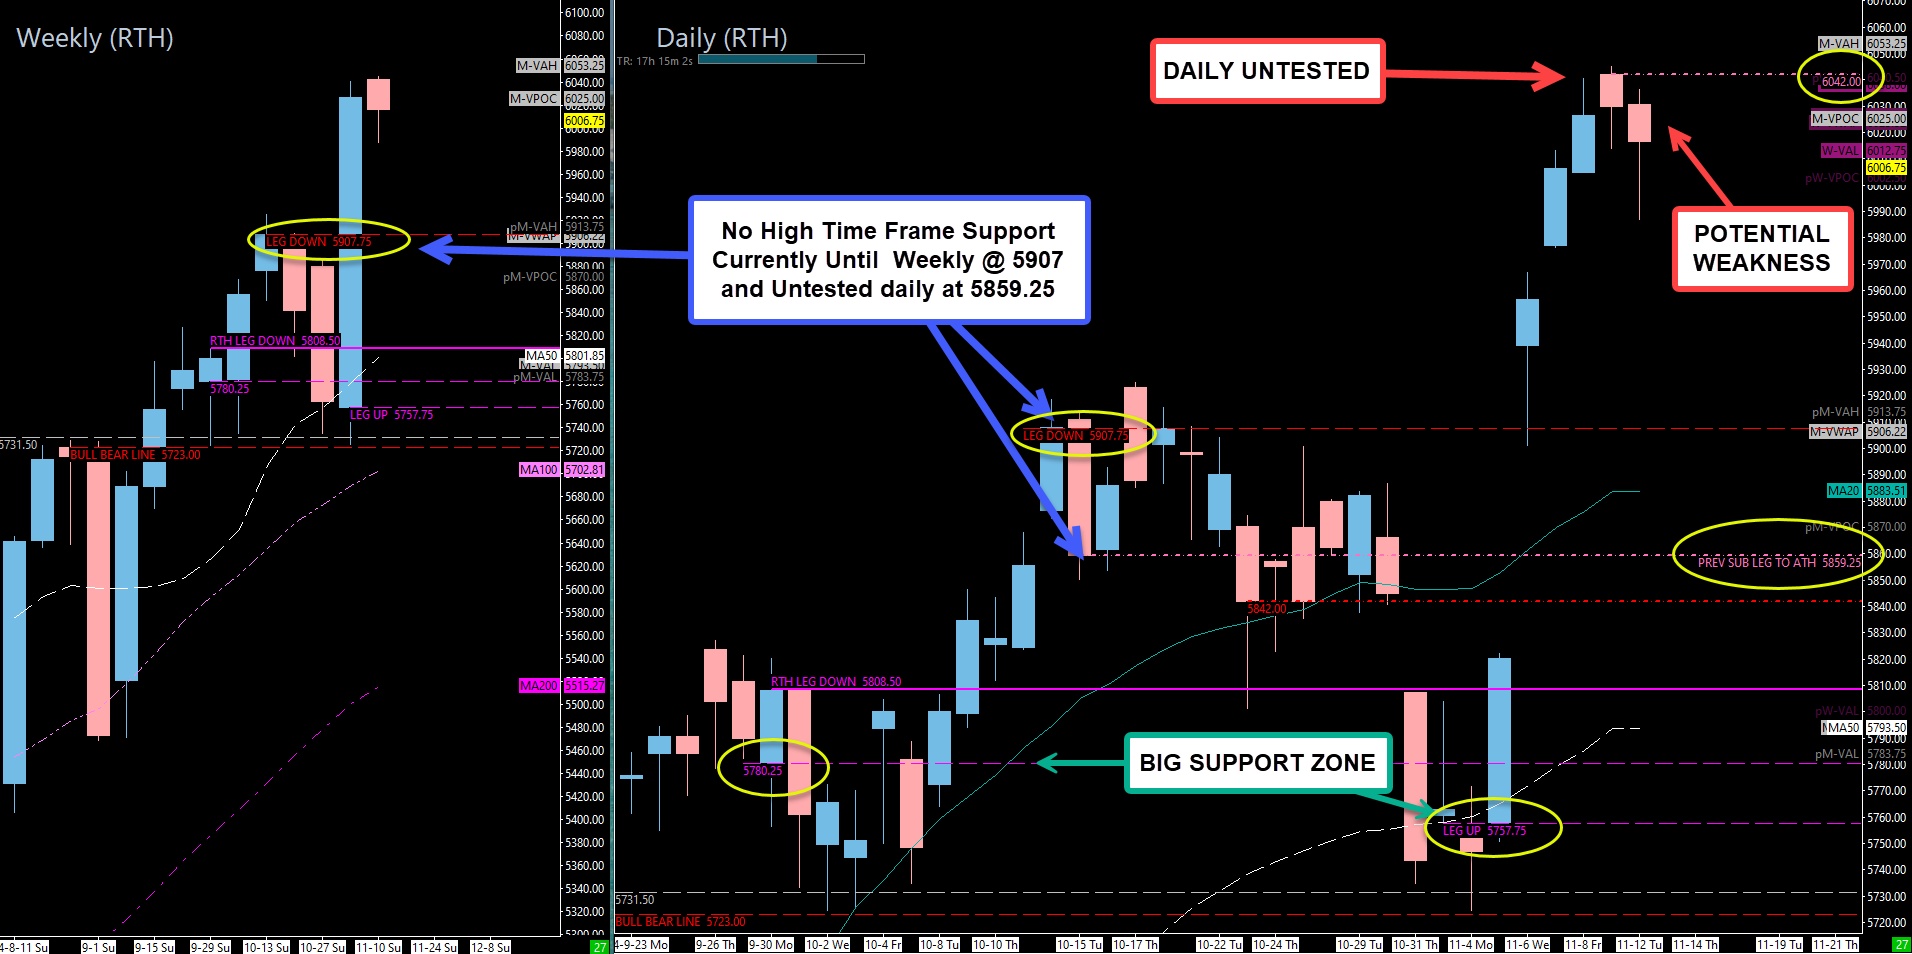
5933.25 (4-Hour Support with Naked POC): A crucial support level and the first major support below 5998.25. This level should provide a reaction, but if it fails, look for a test of 5907.75 (Significant Weekly Support).
5907.75 (Weekly Line in the Sand): This weekly level produced a 130-point rally on first touch and remains a key marker. A break below here could lead to a quick move down to 5859.25 within the weekly gap between 5900 and 5827.
Additional Lower Supports
5859.25 (Untested Daily Subleg): This is a previous subleg to the all-time high, remaining untested. Given its importance, monitor this level closely for a potential reaction if price approaches.
5842 (Significant Daily Level): This tested daily level was critical throughout late October and acted as a key support before breaking, leading to a 100+ point move down. It will once again serve as an above/below guide and should be noted for its potential influence.
5808.50 (Untested Monthly): Previously a pivotal level, this remains untested from above and could provide strong support.
5780.25 - 5757.75 (Weekly Support Zone): A 23-point zone created from the previous weekly leg up to the recent weekly leg, providing an ideal area for potential long positions on a test.
5731.50 (Weekly Support): Another crucial level that will be significant for momentum and positioning above or below.
5723 (Bull-Bear Line): Our final line in the sand for maintaining bullish structure. Holding above 5723 keeps the structure intact; a move below could indicate a shift firmly in favor of the bears.
Tomorrow’s Outlook
The CPI release will bring substantial volatility. I suggest holding off on trades until the initial shakeout has passed. Above, I’m watching 6032 as a key resistance cluster; if price sustains above, it shifts momentum back to the bulls. However, if we hold below this area, 5990, 5978, and 5933 become immediate levels of interest. Keep an eye on how the market reacts to these key zones for potential continuation, and manage trades accordingly.
Stay safe, be patient, and together we’ll conquer these markets!
Ryan Bailey
Vici Trading Solutions