


S&P500 TRADING PLAN: ES FUTURES
10/17/2024

Hello Traders,
Our trade plan played out flawlessly once again. As expected, the 5869 1-hour and 4-hour levels were critical in Globex, and price bounced off them beautifully, giving us a 50-point surge overnight. By the time the market opened, we were already at new all-time highs, only to sell off in the morning and drop below our key level of 5908.
Tomorrow looks like another quiet day for news events, meaning the market could continue to grind higher—or we might see another pullback. However, with low volume at these highs, it’s important to remain cautious. Check out the detailed trade plan below for key levels and what to watch for tomorrow.
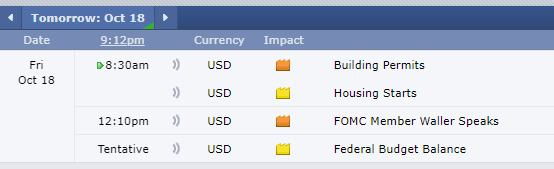
NEWS
NO RED TAGS = MUTED
OPTIONS VOL

LEVELS

CHEAT SHEETZ
WK/DAY TPO

WK DAY - RTH

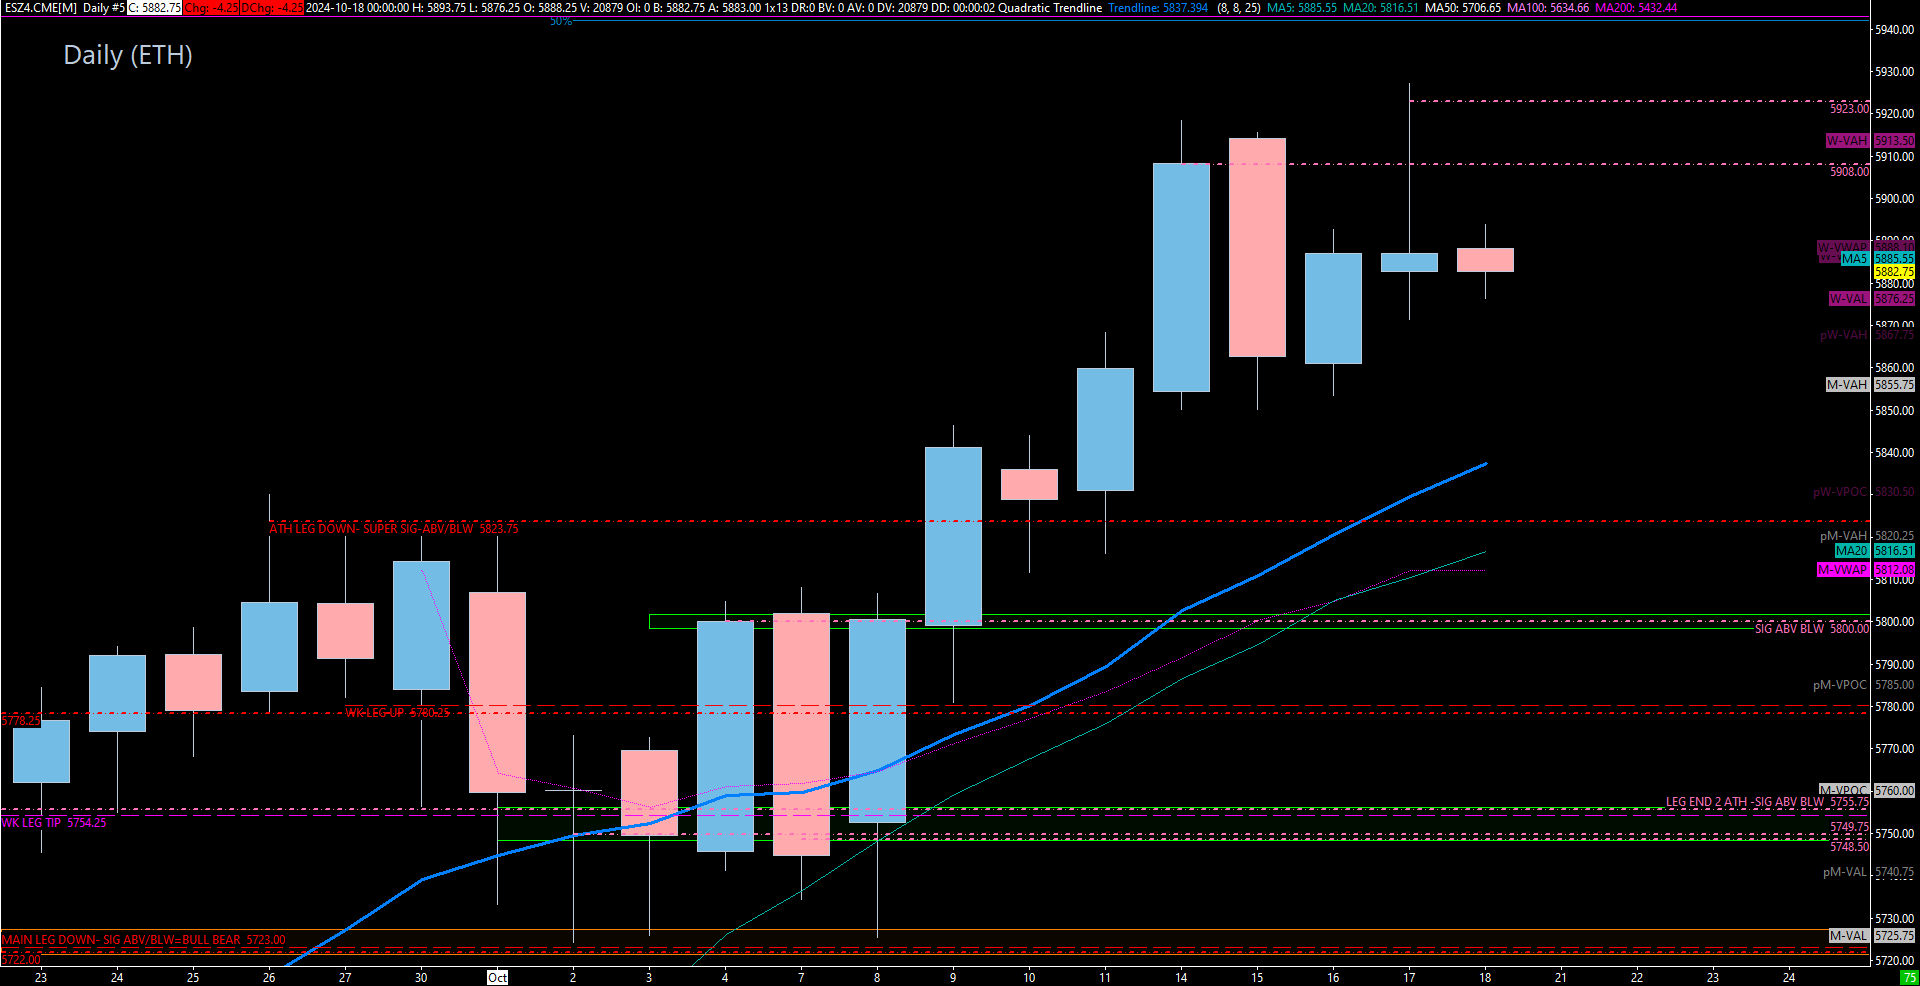
DAILY ETH (23/5)
4HR

1HR

TRADE PLAN
Key Levels to Watch:
5908 to 5923 (Upside Resistance Zone):
This area includes a 4-hour level at 5918.75 and could cause a pullback. While the trend is up, fading into this resistance could make sense if price weakens at these levels.
5853.50 (Major Support):
This 4-hour level has provided significant support so far and remains a key marker for bullish continuation. As long as price holds above this level, we can expect upward momentum. If lost, we may see a sharper pullback.
5840.75 - 5839.75 (1-Hour Cluster):
This cluster also cleans up single prints on the profile. I like this zone for a potential long entry. If we get a reaction here, it’s critical to immediately reclaim 5853.50 to confirm upside continuation.
5829.25 (4-Hour) / 5823.75 (Daily) / 5828 (POC):
A high-confluence zone aligning with Friday’s POC and the previous weekly POC. This is a key area to monitor, as falling below 5823.75 could shift momentum to the downside.
5802-5798.25 (4-Hour Cluster):
This cluster includes an untested daily level at 5800 and offers a prime location for a long entry on first touch.
5813.25 (4-Hour Level) & 5808.50 (4-Hour Level):
The 5813.25 level has been tested multiple times and may not hold again. If 5808.50 plays, look for a quick reclaim of 5813.25 and a push back to 5823.75 to confirm continued upside.
5788.25 (4-Hour Level) & 5786.50 (1-Hour Level):
This is a high-confluence zone with both the naked POC and the current week’s POC aligning.
If 5788.25 holds, look for a reclaim of 5794 (yesterday’s low) and a quick move back above 5800.
5780 (High Timeframe Line in the Sand):
As long as price holds above 5780, the bullish bias remains intact.
Bearish Case:
If we lose 5748.50, we could see a sharp drop toward our major weekly support at 5726. Here’s what to watch on the downside:
5726 (Weekly Level):
This level has held multiple times, but it may not hold again under heavy pressure.
5722 (Daily Level):
Immediate support below 5726. Losing this level could send us quickly into the 5709-5705 zone.
5709-5705 (4-Hour/Daily Combo):
Bulls need to reclaim 5726 quickly if this zone is tested. Failure to do so could accelerate the move lower.
5690 (Weekly Leg Tip):
A sustained break below 5690 would suggest a shift toward bearish momentum.
5668.75 (Major Bull/Bear Line):
This is the critical line in the sand between bullish continuation and bearish momentum. Losing 5668.75 would fully shift momentum to the bears.
5661 (Daily/Weekly Combo):
If this level is tested, an immediate reclaim of 5668.75 is necessary to prevent further breakdowns.
Key Takeaways:
Critical Support Levels:
Monitor 5780, 5823.75, and 5800 for momentum shifts.
Buy Zone:
The 5755.75-5748.50 zone should provide a solid reaction on first touch. If this zone holds, expect a continued rally to new highs.
Bullish Bias:
As long as 5853.50 holds, the bullish momentum remains intact. However, losing 5823.75 could shift momentum lower.
Stay sharp, stick to the plan, and together, let’s conquer these markets!
Ryan Bailey
Vici Trading Solutions