


S&P500 TRADING PLAN: ES FUTURES
FRIDAY - 11/1/2024

Hello traders!
Today was an incredible day for the bears. On the last day of the month, they finally took control after breaking through our significant 5842/37 level. As soon as the Globex session opened Thursday night, price dropped sharply by over 40 points, hitting our 5802 target as we started the day.

After the open, breaking through 5800 extended the slide right down to our 5750 target. This level provided multiple 15-20 point bounces throughout the day, as we expected in the trade plan. However, bulls failed to regain control when they couldn’t break back above our 5770 significant 4-hour level.

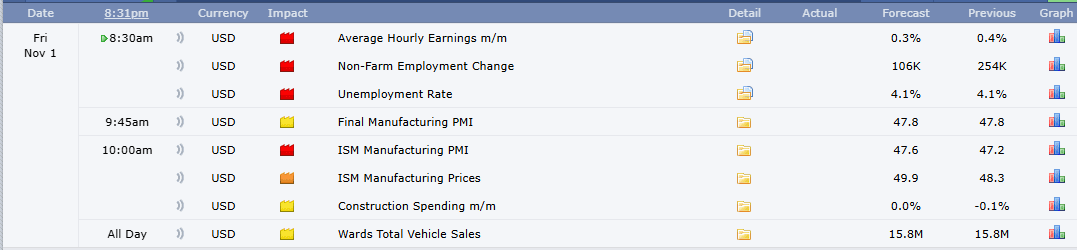
Tomorrow is set to be another big day with key red-tag news—the biggest of the week—including Non-Farm Payroll Change, Unemployment Rate, and Average Hourly Earnings pre-market, and ISM Manufacturing PMI after the open. With these events, volatility is a given. After today’s sell-off, the question is whether bulls will defend the lows or if bears will continue to push lower. Check out the detailed trade plan below for the critical levels to watch and our strategy for navigating tomorrow's market. Stay safe, calm, and patient, and together, we’ll conquer these markets!
Ryan Bailey
Vici Trading Solutions
NEWS
OPTIONS VOL

LEVELS

CHEAT SHEETS
WK/DAY TPO
WK/DAY

4HR

Trade Plan
After yesterday’s significant sell-off, we might expect a potential bounce, so we’re focusing on untested levels above that could prompt a reaction. The soft close below the 5749.75 daily weekly leg end signals continued weakness, and I’m leaning bearish while monitoring levels for short continuation. As always, 5723 is key for the bulls; holding this level keeps their chances alive. However, with so much red-tag news, anything can happen, so we need to remain disciplined and only take setups that align with our plan.
Critical Levels to Watch:
5749.75 / 5754.25 (Daily / Weekly Leg End):
These levels are essential to watch for momentum shifts. If bulls manage to push above this zone, we may see a bounce. However, failure to reclaim this area will likely lead to further downside.5770 (4-Hour Level):
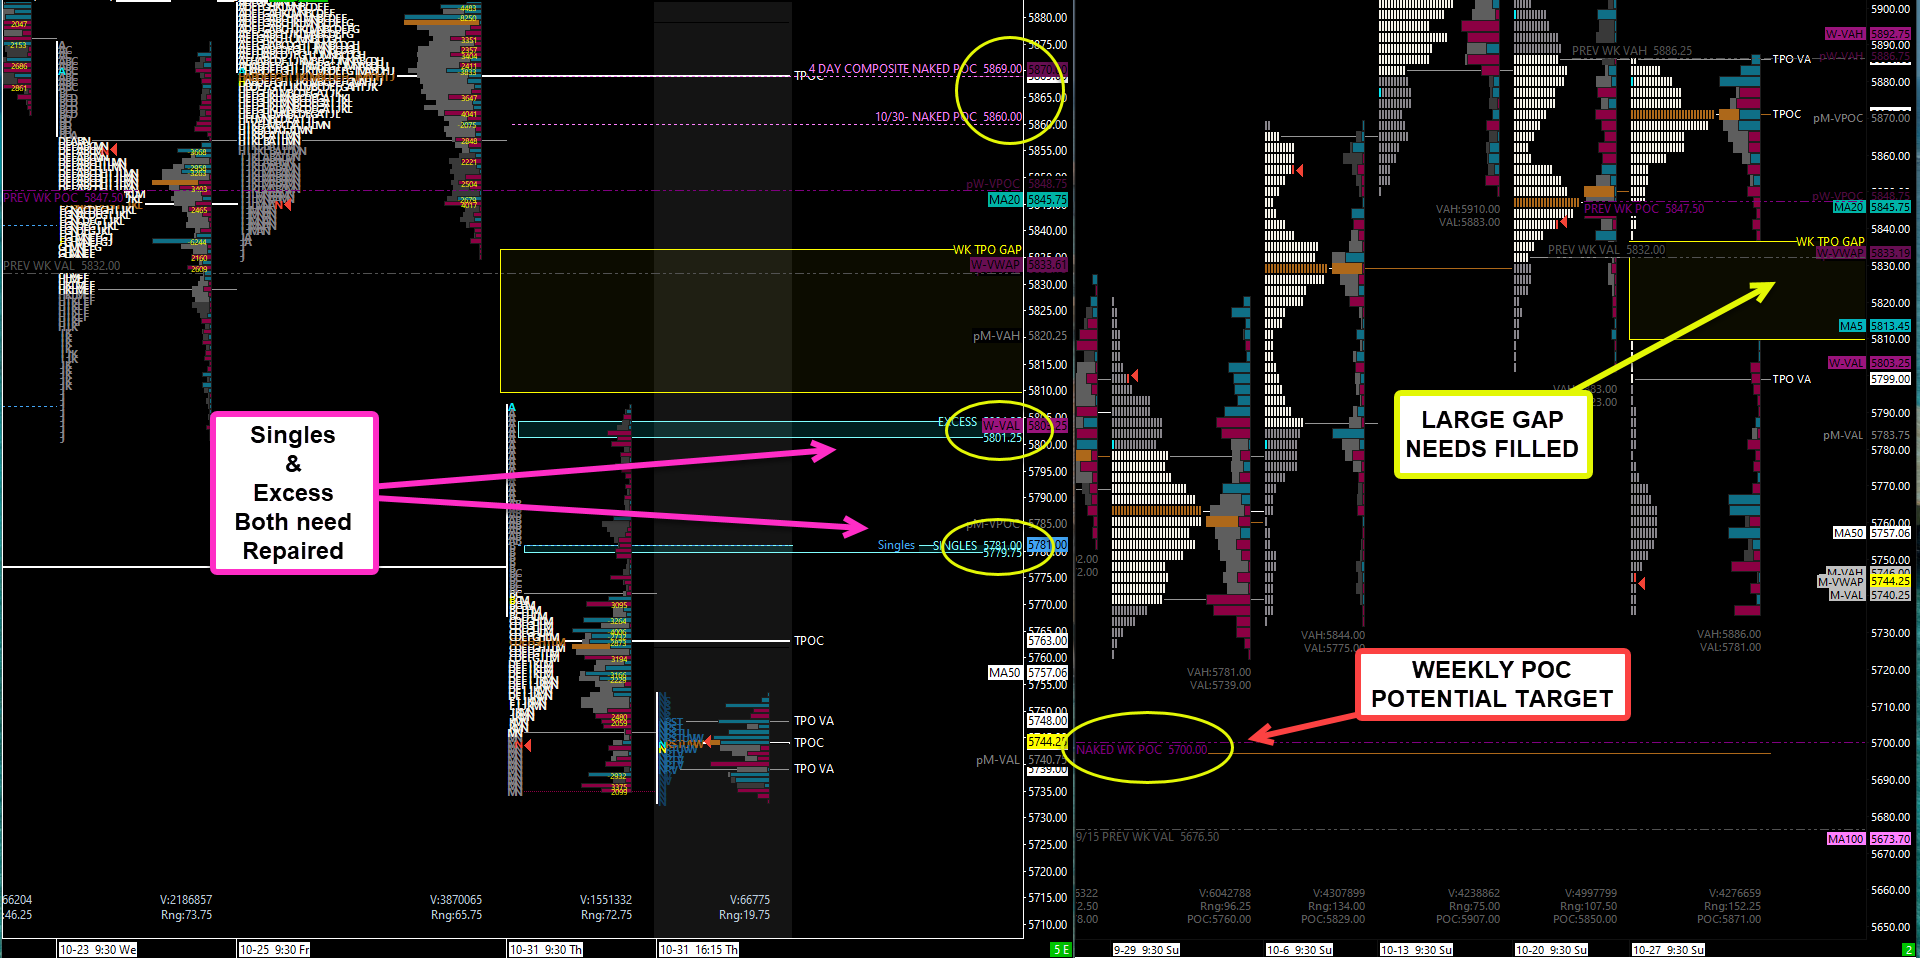
This level has proven its worth, providing strong resistance on multiple tests. If we retest 5770 and price fails to stay above, we can expect another leg lower.5780.25 / 5778.25 (Weekly / Daily):
This untested resistance cluster includes single prints that extend up to 5781. This zone offers substantial confluence, and if price reaches here, I’d expect a solid reaction and look to get back below the 5770 4HR for continued movement lower.5800 (Significant Daily Level):
Another untested daily level from the bottom side, which could see a reaction if price tests it. Additionally, the profile shows excess up to 5803 that needs filling,5823.75 (Significant Daily Level):
Another untested daily level from the bottom side, which could see a reaction if price tests it. We would want to see price stay below this level for downside continuation other wise it could push all the way up to the 5859.25 Untested Daily.5859.25 (Sub-Leg to ATHs):
This is a significant level now untested from the downside, and a reaction here could be key. If price fails to hold above 5842, we may see continued bearish movement from this point.
Key Support Levels to Watch:
5731.50 (Weekly Support):
This level has held before and should be monitored for continuation both up and down.5723 (Critical Weekly Bull/Bear Line):
Serving as our long-standing bull-bear line, this level, paired with 5722 daily support, is pivotal. Losing this zone could lead to a significant momentum shift in favor of the bears.5712.25 (Untested Daily Level):
Not my favorite, but an untested level that could trigger a reaction. If tested, we want to see a reclaim of 5723 for a bullish push.5705.25 (4-Hour Level):
While we could see a reaction here, any strength from this level would require an immediate reclaim of 5712.25 to gain traction.5690.75 (Major Daily Level):
This level is critical. Falling below 5690.75 brings the bears one step closer to full control.5666 (Final Line in the Sand):
This is our ultimate downside marker. Breaking below 5666 would likely hand the bears full control, turning any bounce into a potential short setup.
VIX Insight:
The VIX has held its significant monthly support at 18.14 and is now pushing higher, nearing its key 22.39 weekly resistance. If the VIX breaks above 22.39, expect further downside pressure in the indices. Keep this level in view for additional confluence in the overall market trend.

Key Takeaways:
Watch for Bounce Reactions:
Areas like 5770, 5780.25 - 5778.25, and 5823.75 may offer resistance if price bounces.Crucial Support Zones:
Monitor 5749.75, 5731.50, and 5723 closely. Falling below 5723 shifts the momentum decisively to the bears.Bearish Bias Below 5749.75:
As long as we’re below 5749.75, the bears remain in control, with potential for further downside. Conversely, a reclaim of 5800 could indicate short-term support for bulls.
Stay sharp, follow the plan, and let’s conquer these markets!
Ryan Bailey
Vici Trading Solutions