


S&P500 Trading Plan - ES Futures: Moon Walker Edition
10/15/2024 - Tuesday

Hello Traders,
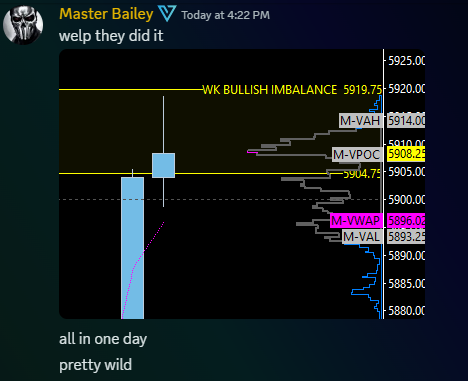
They certainly started Monday with a bang! We woke up to the market already up 25 points, and by premarket, the rally was in full swing. The uptrend continued throughout the day, filling both the daily and weekly bullish imbalances we targeted. This is a prime example of why you never short a low-volume market—or as the saying goes, "Never short a dull market."
Despite it being a bank holiday, with the bond market closed, the low participation fueled a grindy, low-volume rally. Now, with the market surfing new all-time highs, we’re officially in “white space.” I’ll go over Fibonacci extension targets to the upside, as well as potential support zones to watch when the market eventually pauses to accept its newfound value in the 5900s.
Check out the key levels and detailed trade plan below to see how we’ll position for tomorrow's session.
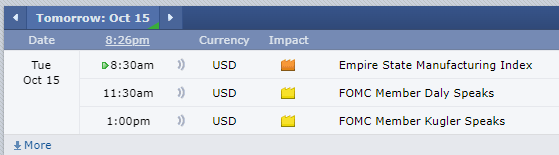
News
Muted News Events:
Options VOL
ES + NQ

Levels
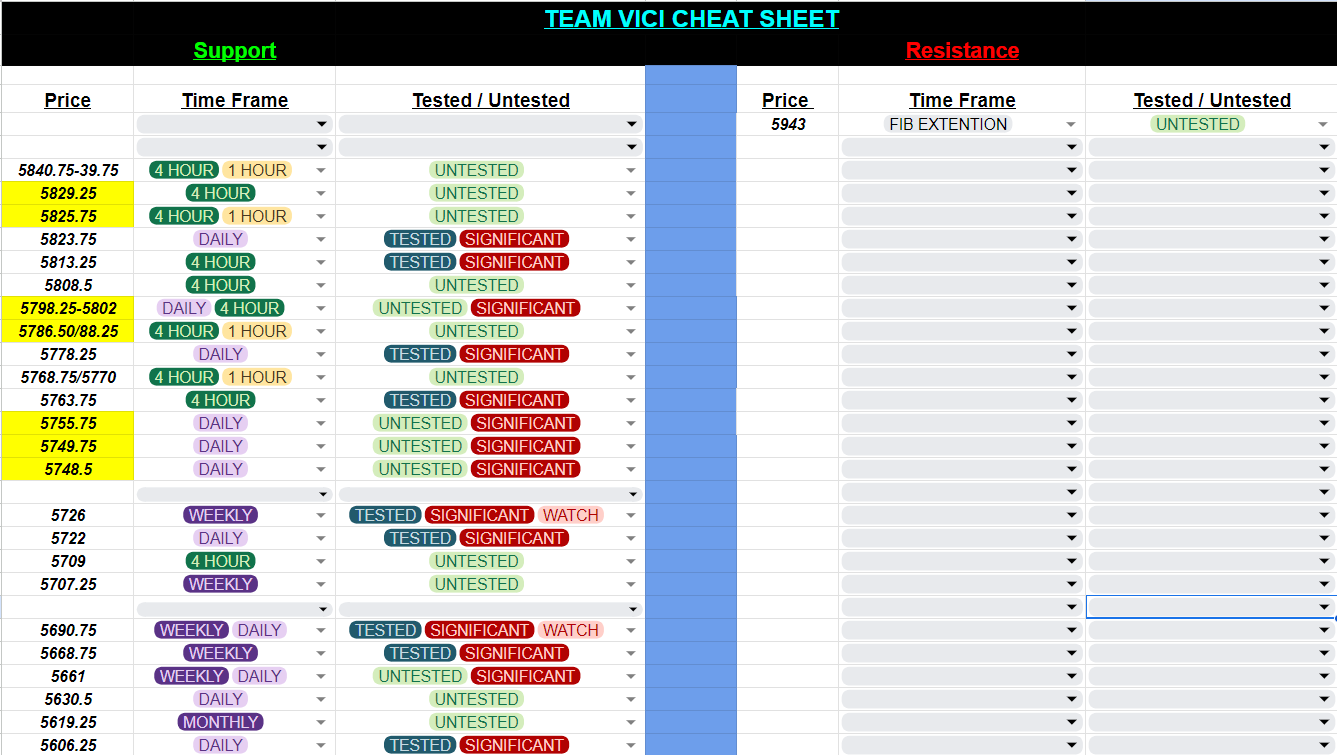
Cheat Sheet
WK TPO

WK DAY

4HR

1HR

Trade Plan
The uptrend continues, and there’s no reason to look for shorts. Fading the trend in a low-volume rally is strongly discouraged. With no major news events expected tomorrow, the market may grind higher once again.
However, with geopolitical events unfolding, it’s crucial to remain vigilant. Below are the upside targets we’re watching, as well as support levels for when the market decides to pull back.
Upside Targets:
5943 (Fibonacci Extension):
Two key Fibonacci levels intersect here, giving this level significant weight as an upside target.
5959.50:
This is an options vol level set for tomorrow.
5993 (61.8% Fibonacci Extension):
If the rally continues uninterrupted, this extension marks the next major target.
Key Support Levels:
5894 (1-Hour Level & Value Area Low):
This level remains untested. If tested, it could provide a pop for a potential long.
5869.50 (1-Hour Support):
There’s an options vol level here, as well as the previous weekly value area high at 5865. While this zone could provide support, it’s better suited as a target for shorts rather than a prime long entry.
5841-5839.75 (Support Cluster):
Includes 4-hour support at 5840.75 and a 1-hour level at 5839.75.
Look for a potential reaction here, especially if we clear the previous high of the day at 5843.
5829.25 (4-Hour Level) & 5828 (POC):
This level aligns with Friday’s POC and the previous weekly POC. Expect a strong reaction if price tests this area.
5802-5798.25 (4-Hour Cluster):
This zone, which includes yesterday’s open, is a prime location for a long entry on the first touch.
Important Markers and Key Levels:
5823.75 (Key Daily Level):
This is our above/below marker for the session. Use it as a guide for bullish continuation or short-term pullbacks.
5813.25 (4-Hour Level) & 5808.50 (4-Hour Level):
The 5813.25 level has been tested multiple times, so if we push lower, it may not hold.
If 5808.50 plays, look for an immediate reclaim of 5813.25 and a move back to 5823.75 for continued upside.
5788.25 (4-Hour Level) & 5786.50 (1-Hour Level):
A high confluence zone with both the naked POC and the current week’s POC.
If 5788.25 plays, watch for a reclaim of yesterday’s low at 5794 and a quick move back above 5800.
5780 (High Timeframe Line in the Sand):
As long as price holds above 5780, the bullish trend remains intact.
5770 (4-Hour Level) & 5768.75 (1-Hour Level):
These levels remain untested. Place stops below 5763.75, a critical support level from the past two weeks.
5755.75 (Daily Level) & 5750 (Support Cluster):
This is the new daily leg up and should provide a strong reaction on the first touch.
Stops for this zone should be placed below 5742.
Bearish Case:
If 5748.50 doesn’t hold, we could quickly slide to our major weekly level at 5726. Here’s what to watch on the downside:
5726 (Weekly Level):
This level has been tested multiple times and has held strong so far. However, another test could result in a breakdown.
5722 (Daily Level):
The next immediate support after 5726. Losing 5722 could lead to a quick drop to 5709-5705.
5709-5705 (4-Hour/Daily Combo):
Bulls need to reclaim 5726 quickly if this zone is tested. Failure to do so could accelerate the move lower.
5690 (Weekly Leg Tip):
A sustained break below 5690 would signal a momentum shift toward the bears.
5668.75 (Major Bull/Bear Line):
This is the line in the sand between bullish continuation and a deeper pullback.
Losing 5668.75 would fully shift momentum to the bears.
5661 (Daily/Weekly Combo):
If price reaches this level, an immediate reclaim of 5668.75 is essential to prevent further breakdowns.
Key Takeaways:
Bullish Trend Continues: As long as we hold 5726, the trend remains bullish.
Targets to Watch:
Above 5800, life is good for the bulls, with 5943 and 5993 acting as key Fibonacci extension targets.
Critical Support Levels:
5780, 5823.75, and 5800 are key levels to monitor for momentum shifts.
If 5755.75-5748.50 holds on a pullback, the bullish structure remains intact.
Stay sharp, stick to the plan, and together, let’s conquer these markets!
Ryan Bailey
Vici Trading Solutions