


S&P 500: Weekend Recap & What’s Next
Week of 10/20/2024

Hello Traders!
We’ve officially completed SIX green weeks in a row, and the market’s relentless bullish momentum shows no signs of slowing down. The big question now is—can this push continue? At the moment, we have no reason to believe it can’t, but with the market sitting at such lofty levels, caution is always warranted.
This week is shaping up to be similar to the last, with limited news events until Thursday, which could bring some volatility. Make sure to check out the video and detailed charts below, along with the trade plan to guide your setups for the week ahead—no matter which direction the market decides to take us.
NEWS:
Another Lack Luster Week Of Red Tag News Events

LEVELS:
WK/DAY TPO
CHEAT SHEETS:
WK/DAY TPO

WK/DAY

4HR
1HR
Trade Plan:
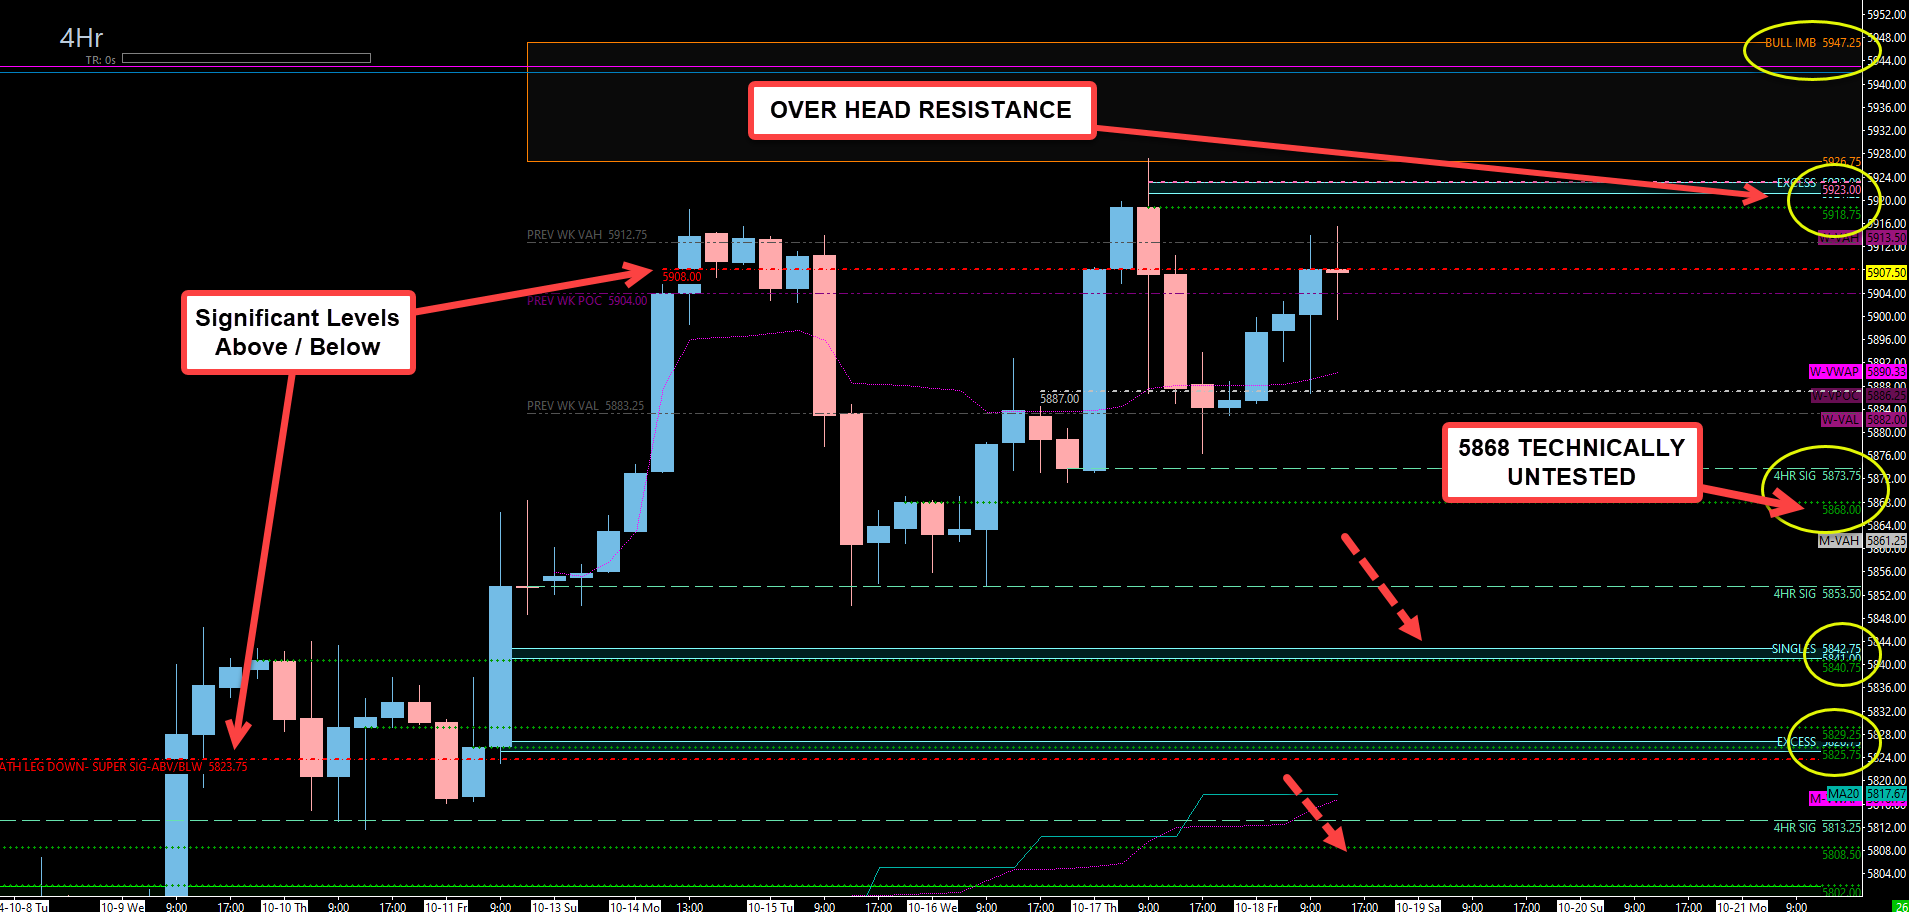
We’re starting this week with a bullish imbalance on the weekly profile, which points us toward an upside target of 5947. However, there’s overhead resistance at 5923, a level that must be closely monitored. Failure to gain above this level may prompt a move back down to support before the next leg higher.
Even though support has held across all timeframes, it’s important to stay vigilant. While the bullish momentum remains intact, a pullback could come out of nowhere. For now, though, the trend remains firmly up, and I’ve highlighted Fibonacci targets at 5943 and 5993 in case we make another all-time high this week.
Key Levels to Watch
Overhead Resistance: 5908 - 5923
This area includes a 4-hour level at 5918.75 and a daily level at 5923. It could provide some reaction, but given the bullish momentum, it may only act as a speed bump.
If we gain above 5923, we can target the weekly imbalance at 5947 and even higher toward the 5993 Fibonacci extension.
Critical Support Zones
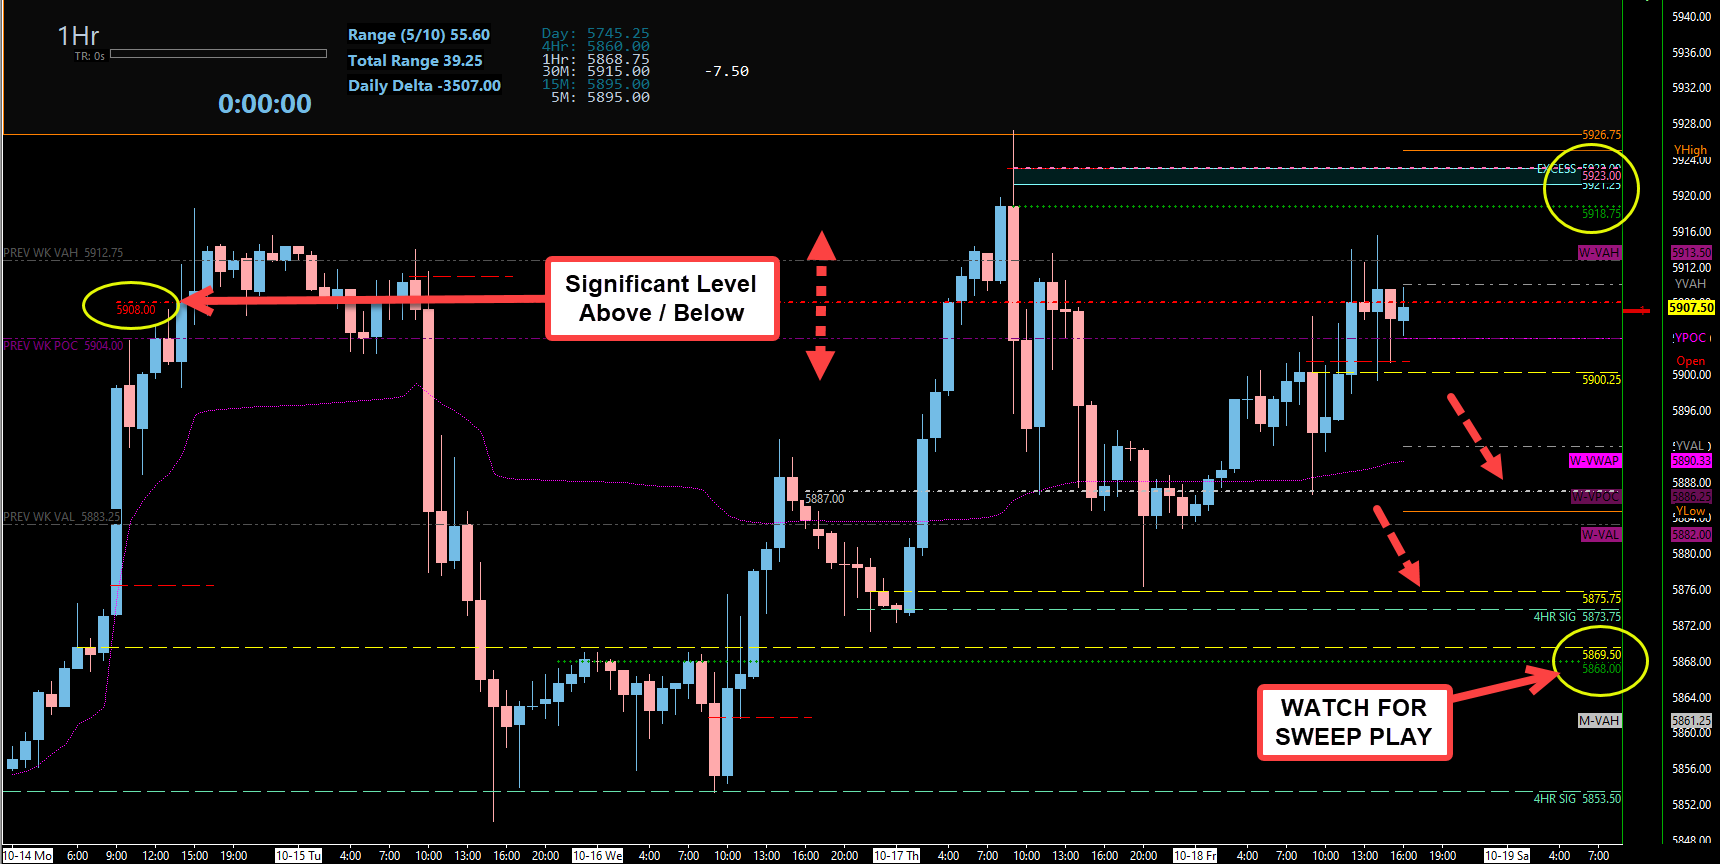
5887 (Daily Level):
This level held on Friday and sent us higher into the close. It’s important to monitor as it sits just above last week’s value area low.5873.75 (4-Hour Level):
This key support held during last week’s pullback from all-time highs. If tested again, we’ll want to see a reaction to maintain the bullish structure.5868 (4-Hour Level):
Untested and could provide a solid reaction. If this level plays, we want to see immediate acceptance back above 5873.75 to confirm continued upside.5755.75-5748.50 (Daily/Weekly Level - Leg End):
This is a massive untested daily and weekly level marking the end of the current leg up. It is critical for continued bullish progression—failure to hold here could shift momentum and raise questions about the strength of the bull trend. This is a high-probability area where we expect a strong reaction on the first touch.
Below These Levels:
5840.75 - 5839.75 (1-Hour Cluster):
This cluster also cleans up single prints on the profile. It’s a prime area for a long entry if we see a reaction. An immediate reclaim of 5853.50 from this zone will confirm upside continuation.5829.25 (4-Hour Level) / 5823.75 (Daily) / 5828 (POC):
A high-confluence zone, aligning with A UNTESTED POC and a previous weekly POC. If 5823.75 doesn’t hold, momentum may shift lower, targeting 5800 next.5802-5798.25 (4-Hour Cluster):
Includes an untested daily level at 5800 and offers a solid entry point for long setups. If this level holds, we’ll look to reclaim 5813.25 and 5823.75 for further upside.
Bearish Case:
If 5748.50 fails to hold, expect a sharp move toward the major weekly level at 5726. Here’s what to watch for:
5726 (Weekly Level):
This level has held several times, but it may not hold again under heavy selling pressure.5722 (Daily Level):
Immediate support below 5726. Losing this level could send us quickly into the 5709-5705 zone.5709-5705 (4-Hour/Daily Combo):
Bulls need to reclaim 5726 quickly if this zone is tested. Failure to do so could accelerate the move lower.5690 (Weekly Leg Tip):
A sustained break below 5690 would suggest a momentum shift toward bearish sentiment.5668.75 (Major Bull/Bear Line):
This is the critical line in the sand. Losing 5668.75 will fully shift momentum to the bears.5661 (Daily/Weekly Combo):
If tested, an immediate reclaim of 5668.75 is necessary to prevent a deeper breakdown.5755.75-5748.50 (Daily/Weekly Level - Leg End):
This is a massive untested daily and weekly level marking the end of the current leg up. It is critical for continued bullish progression—failure to hold here could shift momentum and raise questions about the strength of the bull trend. This is a high-probability area where we expect a strong reaction on the first touch.
Key Takeaways:
Critical Support Levels: 5780, 5823.75, and 5800 are key areas to monitor.
Buy Zone: The 5755.75 - 5748.50 zone is a high-probability support area. If this level holds, expect another push to new all-time highs.
Bullish Bias: As long as 5853.50 holds, the bullish momentum remains intact. However, a break below 5823.75 could shift momentum to the downside.
Stay sharp, stick to the plan, and together, let’s conquer these markets!
Ryan Bailey
Vici Trading Solutions