


S&P 500: Weekend Recap & What’s Next
Week of 10/14/2024

Hello Traders,
We had a fantastic week, following our plan perfectly. The ES rallied from our key "Line in the Sand" level at 5780, which played out beautifully during the Globex session. This move launched us above the 5800 significant level, leading to an abrupt 50-point surge and yet another all-time high.
Our support levels at 5813 and 5823.75 provided great trading opportunities throughout the week, with price bouncing cleanly from these levels multiple times. As we head into next week, it looks like the market is primed to move higher, especially given the current low volatility environment. However, with geopolitical events developing, it’s essential not to take anything for granted.
Take a look below at the trade plan and significant levels to help guide your trading decisions next week. Let’s rest up and be ready—together, we’ll conquer these markets!
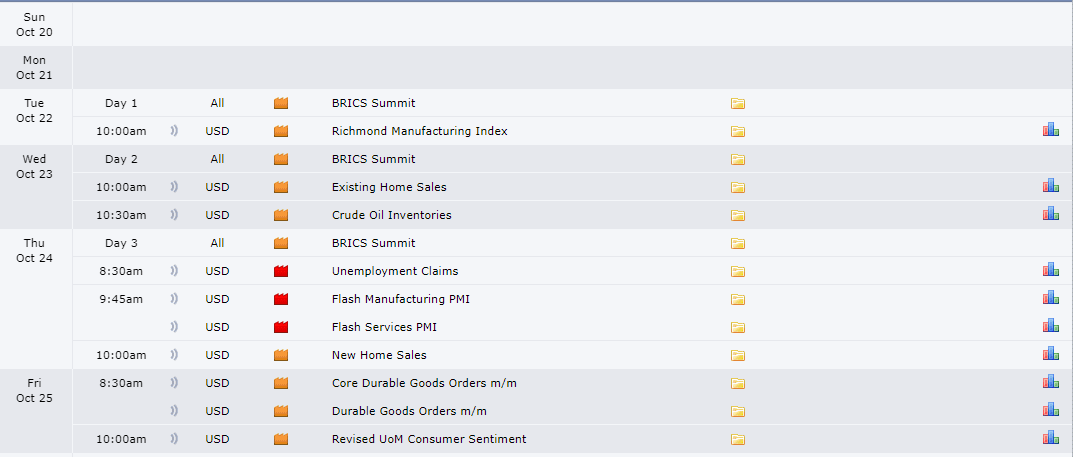
News
Levels

Cheat Sheetz:
Weekly Daily TPO
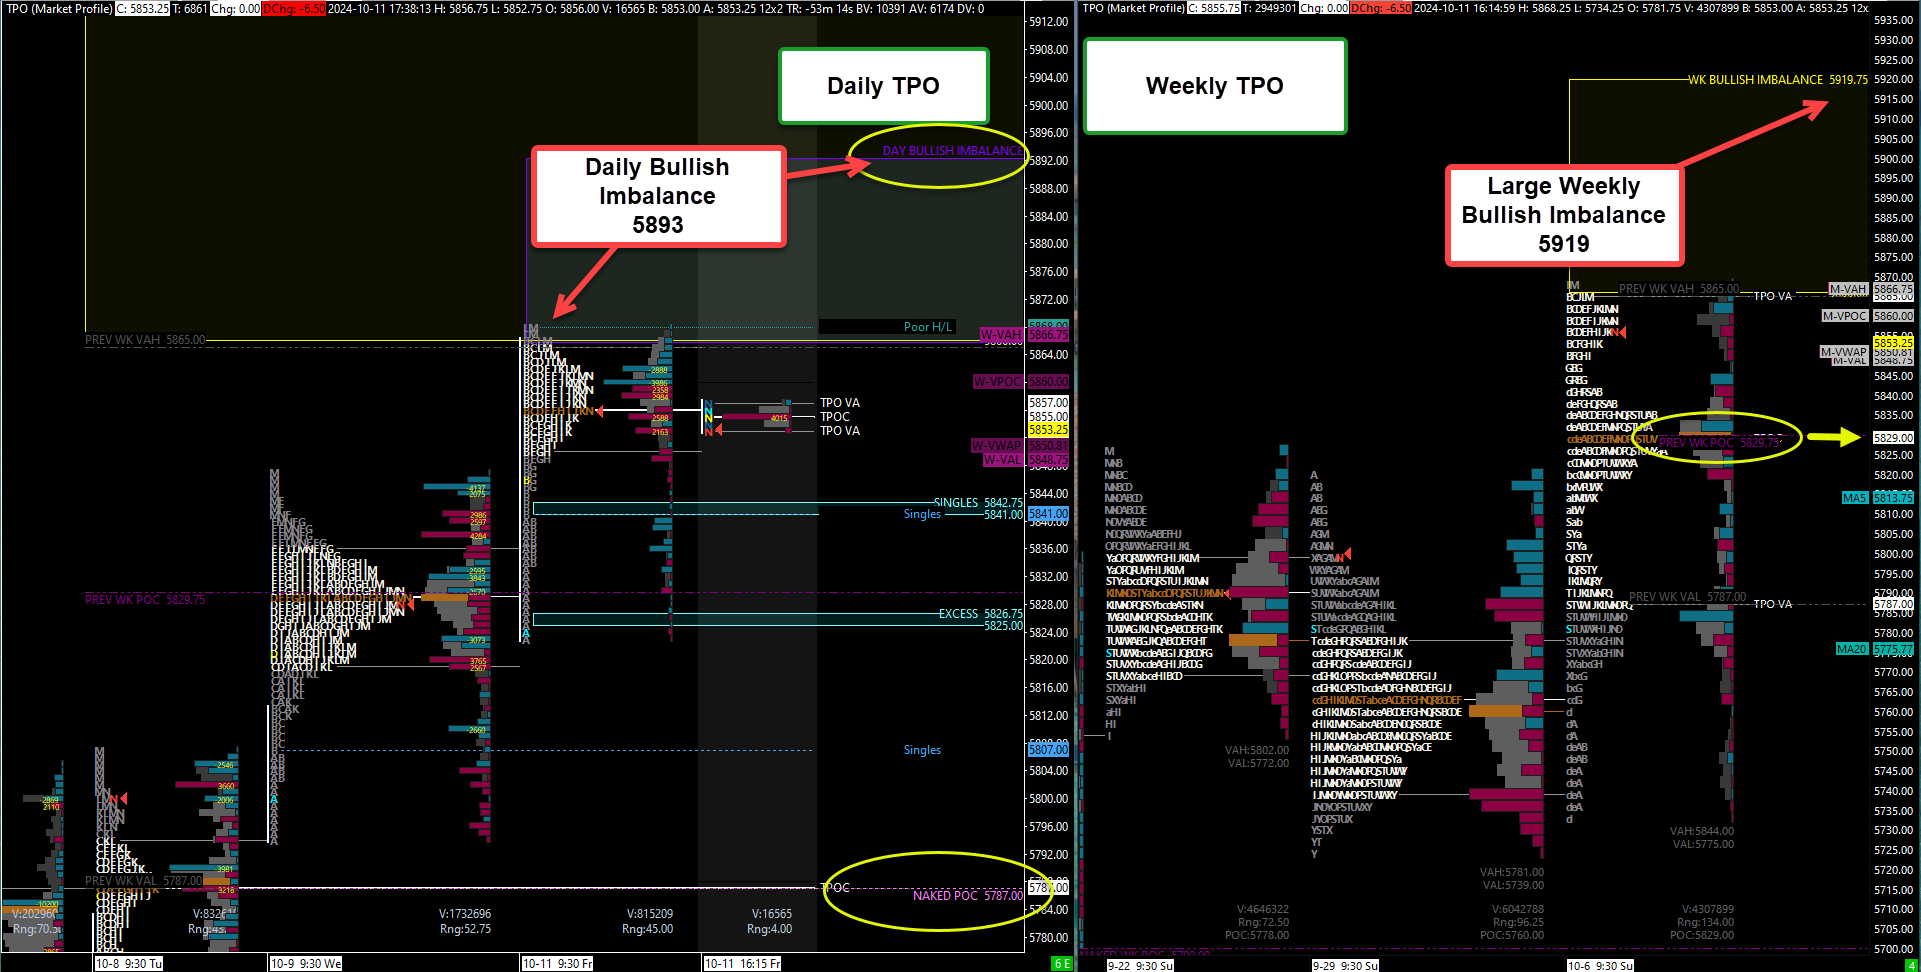
WK/DAY

4hr

What’s Next? Find Out in the Detailed Video Below
Trade Plan:
The bullish trend remains intact, and there’s currently no reason to be looking for downside unless significant levels are lost. The market is working through bullish imbalances with plenty of support below to help maintain upward momentum. Here are the key levels to watch:
Key Support Levels:
5843-5839.75 (Cluster):
Includes singles at 5841, a 4-hour level at 5840.75, and a 1-hour level at 5839.75.
If this zone plays, expect a strong reaction, with continuation likely above the previous high of 5843.
5829.25 (4-Hour Level) / 5828 (POC):
This zone has Friday’s POC and aligns with the previous weekly POC at 5829.75. If tested, it could provide a solid bounce, but would need to see continuation over 5841.
5802-5798.25 (4-Hour Cluster):
This zone includes multiple 4-hour and daily levels and yesterday’s open. It’s a prime long entry zone on first touch.
5788.25 (4-Hour) & 5786.50 (1-Hour Level):
This is a high-confluence area, with both the naked POC and current week’s POC here. A reclaim of 5794 (yesterday’s low) could spark another rally.
5780 (Line in the Sand):
This remains our high timeframe marker. As long as we hold above 5780, the bullish Momentum remains intact.
Untested Areas to Watch:
5770 (4-Hour Level) / 5768.75 (1-Hour Level):
These levels have yet to be tested and could provide a reaction if touched. Place stops below 5763.75, a critical support level for the past two weeks.
5755.75 (Daily) & 5750 (Support Cluster):
This zone marks the daily leg up and should provide a strong reaction on the first touch. Stops should be placed under 5742.
Bearish Case:
If 5748.50 fails to hold, we could quickly slide toward our major weekly support at 5726. Here are the key downside levels:
5726 (Weekly Level):
This level has held multiple times but may not hold again if tested under heavy pressure.
5722 (Daily Level):
Immediate support below 5726. Losing this level could lead to a quick move down to 5709-5705.
5709-5705 (4-Hour/Daily Combo):
This area needs to hold and reclaim 5726 to prevent the bulls from losing control. A break here could accelerate the move lower.
5690 (Weekly Leg Tip):
A sustained break below 5690 would signal a momentum shift toward the bears.
5668.75 (Major Bull/Bear Line):
This is the line in the sand between a bullish continuation or a bearish breakdown. Losing 5668.75 would fully shift momentum to the bears.
5661 (Daily/Weekly Combo):
If tested, this level needs an immediate reclaim of 5668.75 to avoid a catastrophic breakdown in the bullish trend.
Key Takeaways:
Bullish Trend Intact: As long as we remain above 5726, the trend stays bullish.
Key Levels to Monitor:
5823.75, 5800, and 5780 are key markers for momentum shifts.
If price pulls back to 5755.75-5748.50, this area should provide an excellent reaction and set up the next leg higher.
Bottom Line:
Above 5800 (especially 5780), things look good for the bulls.
However, if the market slips below 5726, bearish momentum could take over.
Stay sharp, follow the plan, and together, let’s conquer these markets!
Ryan Bailey
Vici Trading Solutions